| functional annotation |
| Function |
cellulose synthase-like A01 |


|
| GO BP |
|
GO:0071555 [list] [network] cell wall organization
|
(538 genes)
|
IEA
|
 |
|
| GO CC |
|
GO:0000139 [list] [network] Golgi membrane
|
(404 genes)
|
IEA
|
|
|
GO:0005794 [list] [network] Golgi apparatus
|
(1430 genes)
|
IBA
ISM
|
|
|
GO:0016021 [list] [network] integral component of membrane
|
(4803 genes)
|
IEA
|
|
|
| GO MF |
|
GO:0047259 [list] [network] glucomannan 4-beta-mannosyltransferase activity
|
(9 genes)
|
IEA
|
|
|
GO:0051753 [list] [network] mannan synthase activity
|
(17 genes)
|
IBA
|
|
|
GO:0016759 [list] [network] cellulose synthase activity
|
(38 genes)
|
ISS
|
|
|
GO:0016757 [list] [network] transferase activity, transferring glycosyl groups
|
(644 genes)
|
IBA
ISS
|
|
|
| KEGG |
|
|
| Protein |
NP_001319964.1
|
| BLAST |
NP_001319964.1
|
| Orthologous |
[Ortholog page]
LOC103860873 (bra)
|
Subcellular
localization
wolf |
|
plas 6,
E.R. 3,
nucl_plas 3,
golg_plas 3,
cysk_plas 3,
mito_plas 3,
cyto_plas 3
|
(predict for NP_001319964.1)
|
|
Subcellular
localization
TargetP |
|
scret 8
|
(predict for NP_001319964.1)
|
|
| Gene coexpression |
Network*for
coexpressed
genes |
| KEGG* ID |
Title |
#genes |
Link to the KEGG* map
(Multiple genes) |
| ath00592 |
alpha-Linolenic acid metabolism |
4 |
") |
| ath00902 |
Monoterpenoid biosynthesis |
2 |
") |
| ath00904 |
Diterpenoid biosynthesis |
2 |
") |
Genes directly connected with CSLA01 on the network
| coex z* |
Locus |
Function* |
Coexpression
detail |
Entrez Gene ID* |
| 8.1 |
TBL26 |
TRICHOME BIREFRINGENCE-LIKE 26 |
[detail] |
827902 |
| 6.7 |
BSMT1 |
S-adenosyl-L-methionine-dependent methyltransferases superfamily protein |
[detail] |
820321 |
| 6.5 |
CSLA10 |
cellulose synthase-like A10 |
[detail] |
839019 |
| 6.2 |
BAM5 |
beta-amylase 5 |
[detail] |
827185 |
| 6.1 |
FH3 |
formin 3 |
[detail] |
827184 |
| 6.1 |
AT1G73325 |
Kunitz family trypsin and protease inhibitor protein |
[detail] |
843667 |
| 5.6 |
JMT |
jasmonic acid carboxyl methyltransferase |
[detail] |
838551 |
| 5.3 |
4CL8 |
AMP-dependent synthetase and ligase family protein |
[detail] |
833792 |
| 5.3 |
TPS10 |
terpene synthase 10 |
[detail] |
816955 |
|
Coexpressed
gene list |
[Coexpressed gene list for CSLA01]
|
| Gene expression |
| All samples |
[Expression pattern for all samples]
|
AtGenExpress*
(Development) |
245465_at
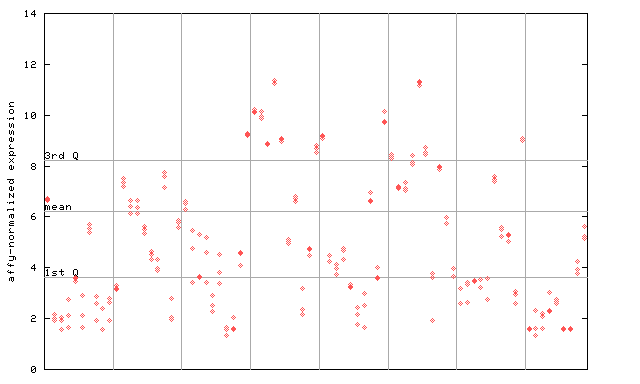
X axis is samples (pdf file), and Y axis is log2-expression.
"1st Q", "mean" and "3rd Q" indecate the values for all genes on a GeneChip. Q: quartile.
|
AtGenExpress*
(Stress) |
245465_at
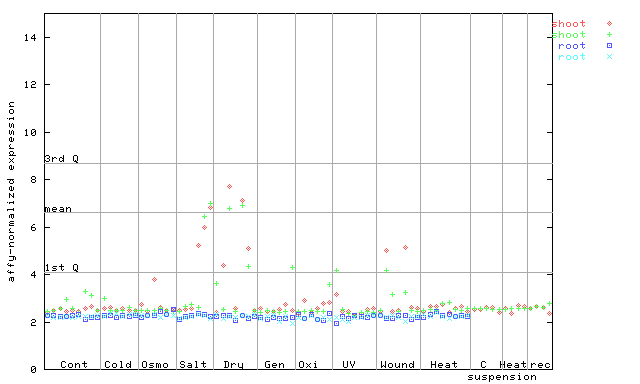
X axis is samples (pdf file), and Y axis is log2-expression.
|
AtGenExpress*
(Hormone) |
245465_at
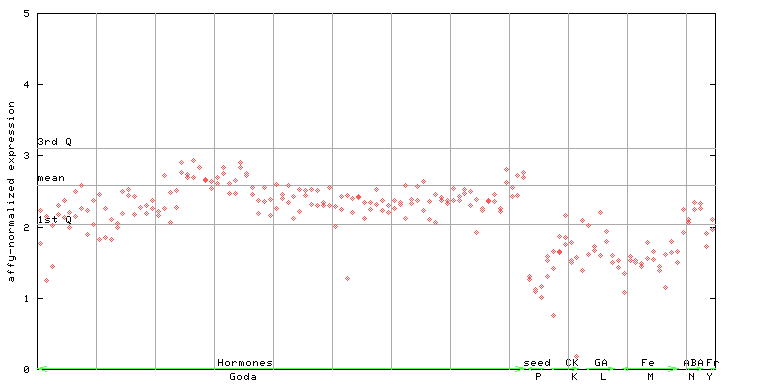
X axis is samples (xls file), and Y axis is log-expression.
|
