| functional annotation |
| Function |
Alkaline phytoceramidase (aPHC) |


|
| GO BP |
|
GO:0010508 [list] [network] positive regulation of autophagy
|
(8 genes)
|
IMP
|
 |
|
GO:0030104 [list] [network] water homeostasis
|
(10 genes)
|
IMP
|
|
|
GO:0002238 [list] [network] response to molecule of fungal origin
|
(17 genes)
|
IMP
|
|
|
GO:0006672 [list] [network] ceramide metabolic process
|
(19 genes)
|
IEA
|
|
|
GO:0010025 [list] [network] wax biosynthetic process
|
(23 genes)
|
IMP
|
|
|
GO:0090333 [list] [network] regulation of stomatal closure
|
(26 genes)
|
IMP
|
|
|
GO:0030148 [list] [network] sphingolipid biosynthetic process
|
(31 genes)
|
IMP
|
|
|
GO:0006914 [list] [network] autophagy
|
(55 genes)
|
IDA
|
|
|
GO:0010150 [list] [network] leaf senescence
|
(111 genes)
|
IMP
|
|
|
GO:0009814 [list] [network] defense response, incompatible interaction
|
(174 genes)
|
IMP
|
|
|
GO:0009738 [list] [network] abscisic acid-activated signaling pathway
|
(194 genes)
|
IEA
|
|
|
GO:0031667 [list] [network] response to nutrient levels
|
(263 genes)
|
IMP
|
|
|
GO:0042742 [list] [network] defense response to bacterium
|
(399 genes)
|
IMP
|
|
|
GO:0009651 [list] [network] response to salt stress
|
(485 genes)
|
IMP
|
|
|
GO:0009737 [list] [network] response to abscisic acid
|
(574 genes)
|
IMP
|
|
|
| GO CC |
|
GO:0000139 [list] [network] Golgi membrane
|
(404 genes)
|
IEA
|
|
|
GO:0005789 [list] [network] endoplasmic reticulum membrane
|
(466 genes)
|
IEA
|
|
|
GO:0005783 [list] [network] endoplasmic reticulum
|
(877 genes)
|
IDA
|
|
|
GO:0005794 [list] [network] Golgi apparatus
|
(1430 genes)
|
IDA
|
|
|
GO:0016021 [list] [network] integral component of membrane
|
(4803 genes)
|
IEA
|
|
|
GO:0005634 [list] [network] nucleus
|
(10793 genes)
|
IDA
|
|
|
| GO MF |
|
GO:0016811 [list] [network] hydrolase activity, acting on carbon-nitrogen (but not peptide) bonds, in linear amides
|
(80 genes)
|
IEA
|
|
|
GO:0046872 [list] [network] metal ion binding
|
(3180 genes)
|
IEA
|
|
|
| KEGG |
ath00600 [list] [network] Sphingolipid metabolism (27 genes) |
 |
| Protein |
NP_567660.1
|
| BLAST |
NP_567660.1
|
| Orthologous |
[Ortholog page]
LOC4333811 (osa)
LOC7495849 (ppo)
LOC11416645 (mtr)
LOC11441439 (mtr)
LOC100273078 (zma)
LOC100273412 (zma)
LOC100787107 (gma)
LOC100814435 (gma)
LOC101257860 (sly)
LOC101268803 (sly)
LOC103859941 (bra)
LOC103861305 (bra)
LOC104878465 (vvi)
|
Subcellular
localization
wolf |
|
nucl 6,
cyto 3,
cysk_nucl 3,
nucl_plas 3
|
(predict for NP_567660.1)
|
|
Subcellular
localization
TargetP |
|
other 9
|
(predict for NP_567660.1)
|
|
| Gene coexpression |
Network*for
coexpressed
genes |
| KEGG* ID |
Title |
#genes |
Link to the KEGG* map
(Multiple genes) |
| ath00230 |
Purine metabolism |
2 |
") |
| ath00240 |
Pyrimidine metabolism |
2 |
") |
Genes directly connected with ATCES1 on the network
| coex z* |
Locus |
Function* |
Coexpression
detail |
Entrez Gene ID* |
| 8.0 |
AT3G49310 |
Major facilitator superfamily protein |
[detail] |
824093 |
| 7.8 |
AT3G07950 |
rhomboid protein-like protein |
[detail] |
819986 |
| 6.4 |
APY2 |
apyrase 2 |
[detail] |
831946 |
|
Coexpressed
gene list |
[Coexpressed gene list for ATCES1]
|
| Gene expression |
| All samples |
[Expression pattern for all samples]
|
AtGenExpress*
(Development) |
254306_at
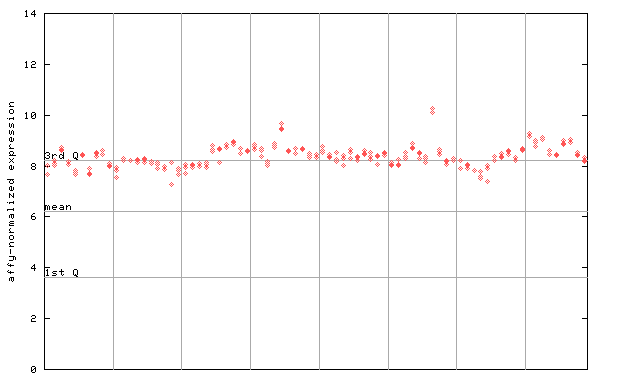
X axis is samples (pdf file), and Y axis is log2-expression.
"1st Q", "mean" and "3rd Q" indecate the values for all genes on a GeneChip. Q: quartile.
|
AtGenExpress*
(Stress) |
254306_at
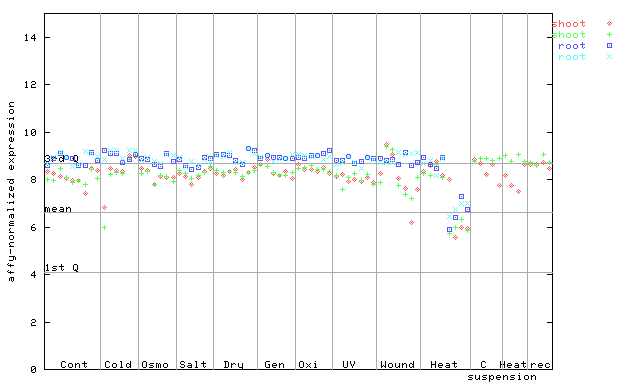
X axis is samples (pdf file), and Y axis is log2-expression.
|
AtGenExpress*
(Hormone) |
254306_at
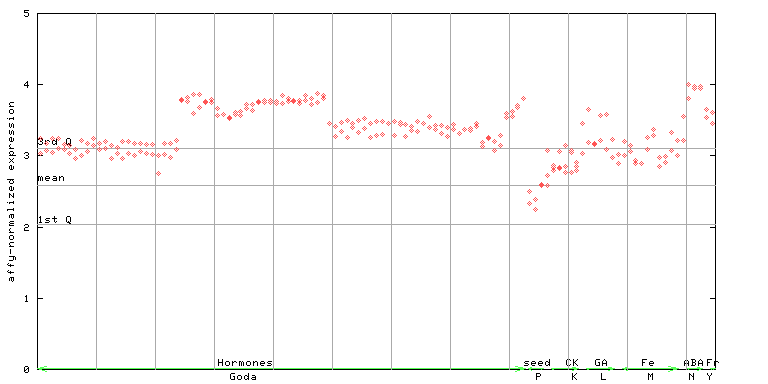
X axis is samples (xls file), and Y axis is log-expression.
|
