[←][→] ath
| functional annotation | ||||||||||||||||||||||||||||||||||||||||||||
| Function | fatty acid desaturase A |


|
||||||||||||||||||||||||||||||||||||||||||
| GO BP |
|
|||||||||||||||||||||||||||||||||||||||||||
| GO CC |
|
|||||||||||||||||||||||||||||||||||||||||||
| GO MF |
|
|||||||||||||||||||||||||||||||||||||||||||
| KEGG | ||||||||||||||||||||||||||||||||||||||||||||
| Protein | NP_194433.1 | |||||||||||||||||||||||||||||||||||||||||||
| BLAST | NP_194433.1 | |||||||||||||||||||||||||||||||||||||||||||
| Orthologous | [Ortholog page] AT2G22890 (ath) AT1G62190 (ath) LOC11423698 (mtr) LOC100257229 (vvi) LOC100793638 (gma) LOC100795628 (gma) LOC101252202 (sly) LOC103641109 (zma) LOC103642464 (zma) LOC103834822 (bra) LOC103835525 (bra) LOC103847595 (bra) LOC103861670 (bra) LOC103866795 (bra) LOC107277927 (osa) | |||||||||||||||||||||||||||||||||||||||||||
| Subcellular localization wolf |
|
|||||||||||||||||||||||||||||||||||||||||||
| Subcellular localization TargetP |
|
|||||||||||||||||||||||||||||||||||||||||||
| Gene coexpression | ||||||||||||||||||||||||||||||||||||||||||||
| Network*for coexpressed genes |
|
|||||||||||||||||||||||||||||||||||||||||||
|---|---|---|---|---|---|---|---|---|---|---|---|---|---|---|---|---|---|---|---|---|---|---|---|---|---|---|---|---|---|---|---|---|---|---|---|---|---|---|---|---|---|---|---|---|
| Coexpressed gene list |
[Coexpressed gene list for FADA] | |||||||||||||||||||||||||||||||||||||||||||
| Gene expression | ||||||||||||||||||||||||||||||||||||||||||||
| All samples | [Expression pattern for all samples] | |||||||||||||||||||||||||||||||||||||||||||
| AtGenExpress* (Development) |
253943_at
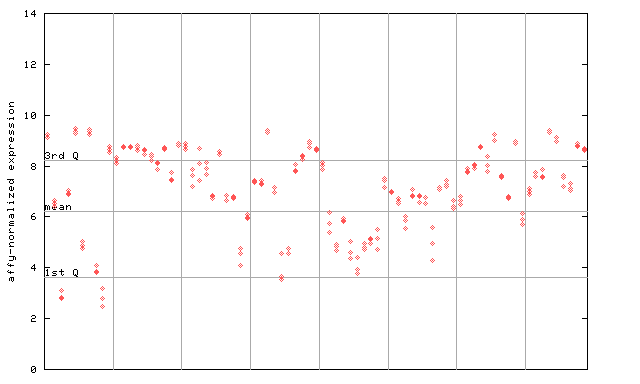
X axis is samples (pdf file), and Y axis is log2-expression. |
|||||||||||||||||||||||||||||||||||||||||||
| AtGenExpress* (Stress) |
253943_at
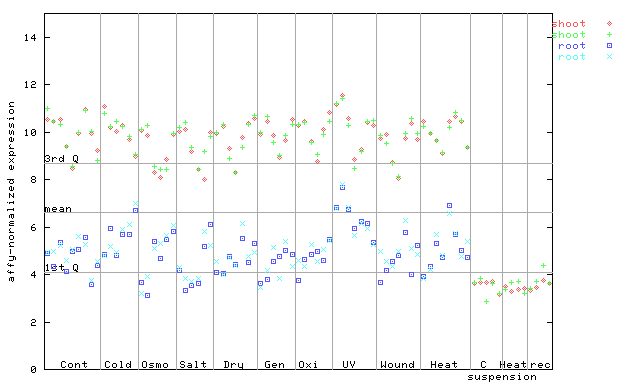
X axis is samples (pdf file), and Y axis is log2-expression. |
|||||||||||||||||||||||||||||||||||||||||||
| AtGenExpress* (Hormone) |
253943_at
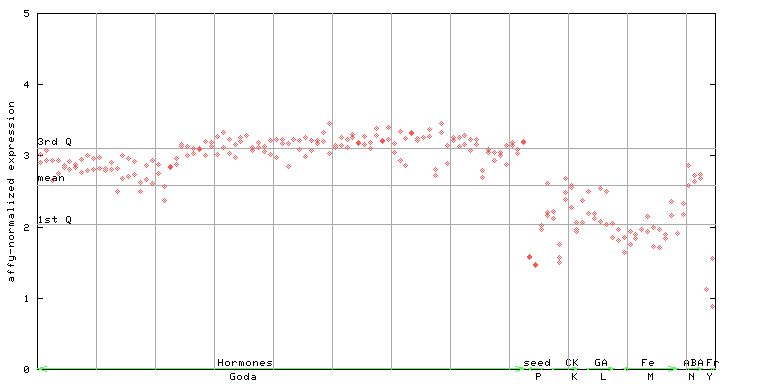
X axis is samples (xls file), and Y axis is log-expression. |
|||||||||||||||||||||||||||||||||||||||||||


")
| Link to other DBs | ||
| Entrez Gene ID | 828811 |
|
| Refseq ID (protein) | NP_194433.1 | |
The preparation time of this page was 0.2 [sec].