[←][→] ath
| functional annotation | ||||||||||||||||||||||||||||||||||||||||||||||
| Function | elongation factor Ts family protein |

 Plant GARDEN Plant GARDEN JBrowse
|
||||||||||||||||||||||||||||||||||||||||||||
| GO BP |
|
|||||||||||||||||||||||||||||||||||||||||||||
| GO CC |
|
|||||||||||||||||||||||||||||||||||||||||||||
| GO MF |
|
|||||||||||||||||||||||||||||||||||||||||||||
| KEGG | ||||||||||||||||||||||||||||||||||||||||||||||
| Protein | NP_001031743.1 NP_567820.1 | |||||||||||||||||||||||||||||||||||||||||||||
| BLAST | NP_001031743.1 NP_567820.1 | |||||||||||||||||||||||||||||||||||||||||||||
| Orthologous | [Ortholog page] LOC4352441 (osa) LOC7458776 (ppo) LOC11427581 (mtr) LOC100797166 (gma) LOC100804285 (gma) LOC101245558 (sly) LOC103853867 (bra) LOC123102619 (tae) LOC123110803 (tae) LOC123119801 (tae) LOC123397951 (hvu) | |||||||||||||||||||||||||||||||||||||||||||||
| Subcellular localization wolf |
|
|||||||||||||||||||||||||||||||||||||||||||||
| Subcellular localization TargetP |
|
|||||||||||||||||||||||||||||||||||||||||||||
| Gene coexpression | ||||||||||||||||||||||||||||||||||||||||||||||
| Network*for coexpressed genes |
|
|||||||||||||||||||||||||||||||||||||||||||||
|---|---|---|---|---|---|---|---|---|---|---|---|---|---|---|---|---|---|---|---|---|---|---|---|---|---|---|---|---|---|---|---|---|---|---|---|---|---|---|---|---|---|---|---|---|---|---|
| Coexpressed gene list |
[Coexpressed gene list for emb2726] | |||||||||||||||||||||||||||||||||||||||||||||
| Gene expression | ||||||||||||||||||||||||||||||||||||||||||||||
| All samples | [Expression pattern for all samples] | |||||||||||||||||||||||||||||||||||||||||||||
| AtGenExpress* (Development) |
253758_at
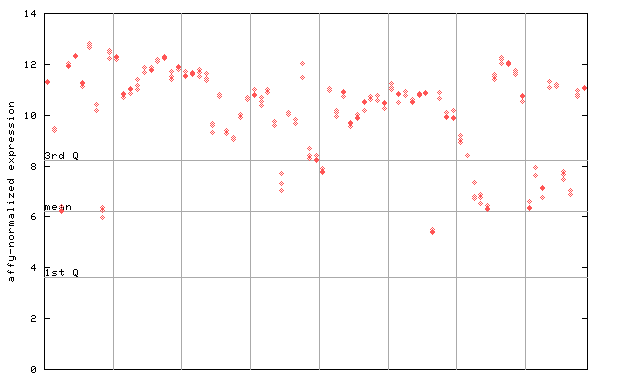
X axis is samples (pdf file), and Y axis is log2-expression. |
|||||||||||||||||||||||||||||||||||||||||||||
| AtGenExpress* (Stress) |
253758_at
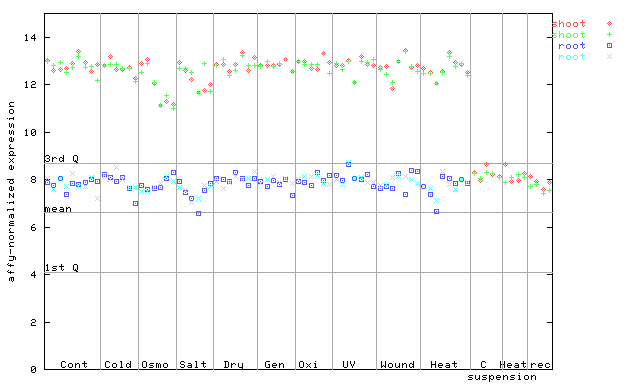
X axis is samples (pdf file), and Y axis is log2-expression. |
|||||||||||||||||||||||||||||||||||||||||||||
| AtGenExpress* (Hormone) |
253758_at
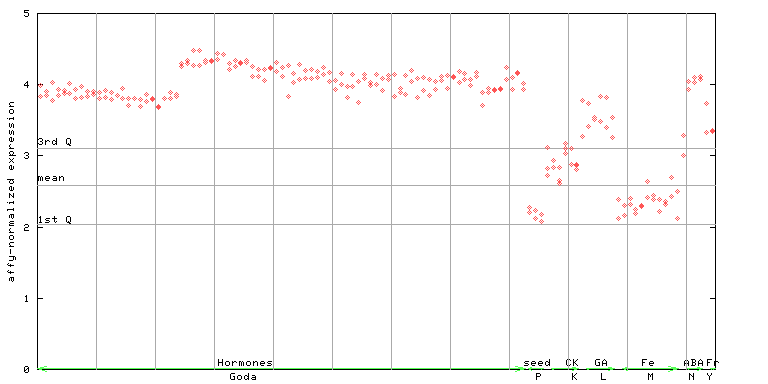
X axis is samples (xls file), and Y axis is log-expression. |
|||||||||||||||||||||||||||||||||||||||||||||


| Link to other DBs | ||
| Entrez Gene ID | 829027 |
|
| Refseq ID (protein) | NP_001031743.1 | |
| NP_567820.1 | |
|
The preparation time of this page was 0.1 [sec].