[←][→] ath
| functional annotation | |||||||||||||||||||||||||||||||||||||||||||||||||||||||||||
| Function | ATP-dependent RNA helicase |


|
|||||||||||||||||||||||||||||||||||||||||||||||||||||||||
| GO BP |
|
||||||||||||||||||||||||||||||||||||||||||||||||||||||||||
| GO CC |
|
||||||||||||||||||||||||||||||||||||||||||||||||||||||||||
| GO MF |
|
||||||||||||||||||||||||||||||||||||||||||||||||||||||||||
| KEGG | |||||||||||||||||||||||||||||||||||||||||||||||||||||||||||
| Protein | NP_194730.1 | ||||||||||||||||||||||||||||||||||||||||||||||||||||||||||
| BLAST | NP_194730.1 | ||||||||||||||||||||||||||||||||||||||||||||||||||||||||||
| Orthologous | [Ortholog page] LOC7484068 (ppo) LOC7485502 (ppo) LOC9268832 (osa) LOC11443216 (mtr) LOC100527402 (gma) LOC100816387 (gma) LOC101257274 (sly) LOC103834694 (bra) LOC103861920 (bra) LOC123132536 (tae) LOC123136607 (tae) LOC123144119 (tae) LOC123401703 (hvu) | ||||||||||||||||||||||||||||||||||||||||||||||||||||||||||
| Subcellular localization wolf |
|
||||||||||||||||||||||||||||||||||||||||||||||||||||||||||
| Subcellular localization TargetP |
|
||||||||||||||||||||||||||||||||||||||||||||||||||||||||||
| Gene coexpression | |||||||||||||||||||||||||||||||||||||||||||||||||||||||||||
| Network*for coexpressed genes |
|
||||||||||||||||||||||||||||||||||||||||||||||||||||||||||
|---|---|---|---|---|---|---|---|---|---|---|---|---|---|---|---|---|---|---|---|---|---|---|---|---|---|---|---|---|---|---|---|---|---|---|---|---|---|---|---|---|---|---|---|---|---|---|---|---|---|---|---|---|---|---|---|---|---|---|---|
| Coexpressed gene list |
[Coexpressed gene list for AT4G30010] | ||||||||||||||||||||||||||||||||||||||||||||||||||||||||||
| Gene expression | |||||||||||||||||||||||||||||||||||||||||||||||||||||||||||
| All samples | [Expression pattern for all samples] | ||||||||||||||||||||||||||||||||||||||||||||||||||||||||||
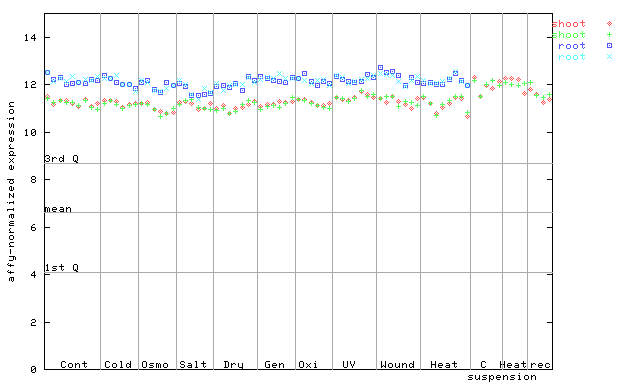
| AtGenExpress* (Development) |
253670_at
X axis is samples (pdf file), and Y axis is log2-expression. |
||||||||||||||||||||||||||||||||||||||||||||||||||||||||||
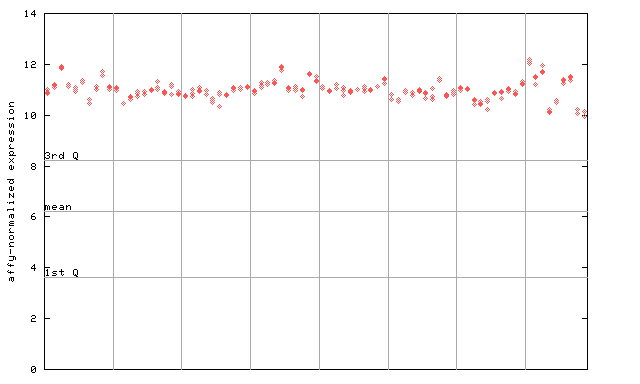
| AtGenExpress* (Stress) |
253670_at
X axis is samples (pdf file), and Y axis is log2-expression. |
||||||||||||||||||||||||||||||||||||||||||||||||||||||||||
| AtGenExpress* (Hormone) |
253670_at
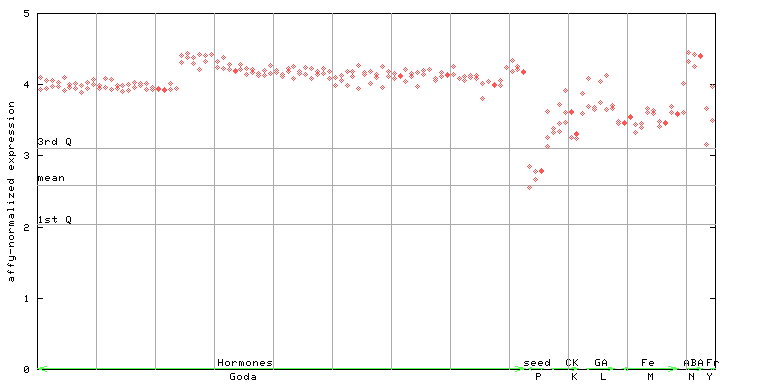
X axis is samples (xls file), and Y axis is log-expression. |
||||||||||||||||||||||||||||||||||||||||||||||||||||||||||


")
| Link to other DBs | ||
| Entrez Gene ID | 829124 |
|
| Refseq ID (protein) | NP_194730.1 | |
The preparation time of this page was 0.1 [sec].