[←][→] ath
| functional annotation | ||||||||||||||||||||||||||||||||||||||||||||||||||
| Function | aldehyde dehydrogenase 3I1 |


|
||||||||||||||||||||||||||||||||||||||||||||||||
| GO BP |
|
|||||||||||||||||||||||||||||||||||||||||||||||||
| GO CC |
|
|||||||||||||||||||||||||||||||||||||||||||||||||
| GO MF |
|
|||||||||||||||||||||||||||||||||||||||||||||||||
| KEGG | ath00010 [list] [network] Glycolysis / Gluconeogenesis (119 genes) |  |
||||||||||||||||||||||||||||||||||||||||||||||||
| ath00053 [list] [network] Ascorbate and aldarate metabolism (63 genes) | |
|||||||||||||||||||||||||||||||||||||||||||||||||
| ath00071 [list] [network] Fatty acid degradation (47 genes) | |
|||||||||||||||||||||||||||||||||||||||||||||||||
| ath00280 [list] [network] Valine, leucine and isoleucine degradation (52 genes) | |
|||||||||||||||||||||||||||||||||||||||||||||||||
| ath00310 [list] [network] Lysine degradation (31 genes) | |
|||||||||||||||||||||||||||||||||||||||||||||||||
| ath00330 [list] [network] Arginine and proline metabolism (54 genes) | |
|||||||||||||||||||||||||||||||||||||||||||||||||
| ath00340 [list] [network] Histidine metabolism (19 genes) | |
|||||||||||||||||||||||||||||||||||||||||||||||||
| ath00380 [list] [network] Tryptophan metabolism (64 genes) | |
|||||||||||||||||||||||||||||||||||||||||||||||||
| ath00410 [list] [network] beta-Alanine metabolism (47 genes) | |
|||||||||||||||||||||||||||||||||||||||||||||||||
| ath00561 [list] [network] Glycerolipid metabolism (66 genes) | |
|||||||||||||||||||||||||||||||||||||||||||||||||
| ath00620 [list] [network] Pyruvate metabolism (97 genes) | |
|||||||||||||||||||||||||||||||||||||||||||||||||
| ath00770 [list] [network] Pantothenate and CoA biosynthesis (34 genes) | |
|||||||||||||||||||||||||||||||||||||||||||||||||
| ath00903 [list] [network] Limonene and pinene degradation (6 genes) | |
|||||||||||||||||||||||||||||||||||||||||||||||||
| ath01240 [list] [network] Biosynthesis of cofactors (236 genes) | |
|||||||||||||||||||||||||||||||||||||||||||||||||
| Protein | NP_001329319.1 NP_001329320.1 NP_567962.1 NP_974679.1 | |||||||||||||||||||||||||||||||||||||||||||||||||
| BLAST | NP_001329319.1 NP_001329320.1 NP_567962.1 NP_974679.1 | |||||||||||||||||||||||||||||||||||||||||||||||||
| Orthologous | [Ortholog page] ALDH3H1 (ath) LOC4349966 (osa) LOC7460961 (ppo) LOC7466457 (ppo) LOC7479170 (ppo) LOC9271186 (osa) LOC11411505 (mtr) LOC11441005 (mtr) LOC18095692 (ppo) LOC25482459 (mtr) ALDH3H4 (gma) ALDH3H2 (gma) ALDH3I1 (gma) ALDH3H1 (gma) ALDH3H3 (gma) ALD3H1 (sly) LOC103833133 (bra) LOC103840237 (bra) LOC103868729 (bra) LOC123086691 (tae) LOC123091307 (tae) LOC123096283 (tae) LOC123102835 (tae) LOC123111064 (tae) LOC123120057 (tae) LOC123447931 (hvu) LOC123452913 (hvu) | |||||||||||||||||||||||||||||||||||||||||||||||||
| Subcellular localization wolf |
|
|||||||||||||||||||||||||||||||||||||||||||||||||
| Subcellular localization TargetP |
|
|||||||||||||||||||||||||||||||||||||||||||||||||
| Gene coexpression | ||||||||||||||||||||||||||||||||||||||||||||||||||
| Network*for coexpressed genes |
|
|||||||||||||||||||||||||||||||||||||||||||||||||
|---|---|---|---|---|---|---|---|---|---|---|---|---|---|---|---|---|---|---|---|---|---|---|---|---|---|---|---|---|---|---|---|---|---|---|---|---|---|---|---|---|---|---|---|---|---|---|---|---|---|---|
| Coexpressed gene list |
[Coexpressed gene list for ALDH3I1] | |||||||||||||||||||||||||||||||||||||||||||||||||
| Gene expression | ||||||||||||||||||||||||||||||||||||||||||||||||||
| All samples | [Expression pattern for all samples] | |||||||||||||||||||||||||||||||||||||||||||||||||
| AtGenExpress* (Development) |
253237_at
X axis is samples (pdf file), and Y axis is log2-expression. |
|||||||||||||||||||||||||||||||||||||||||||||||||
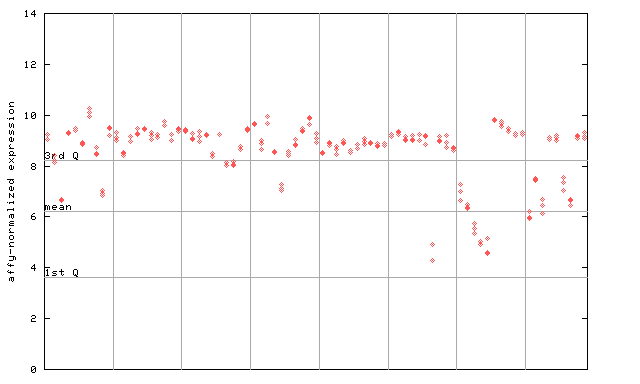
| AtGenExpress* (Stress) |
253237_at
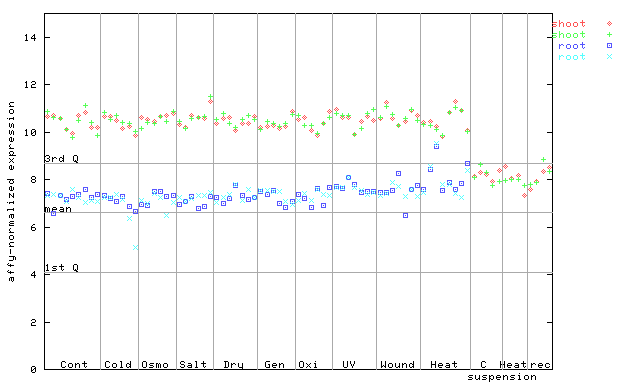
X axis is samples (pdf file), and Y axis is log2-expression. |
|||||||||||||||||||||||||||||||||||||||||||||||||
| AtGenExpress* (Hormone) |
253237_at
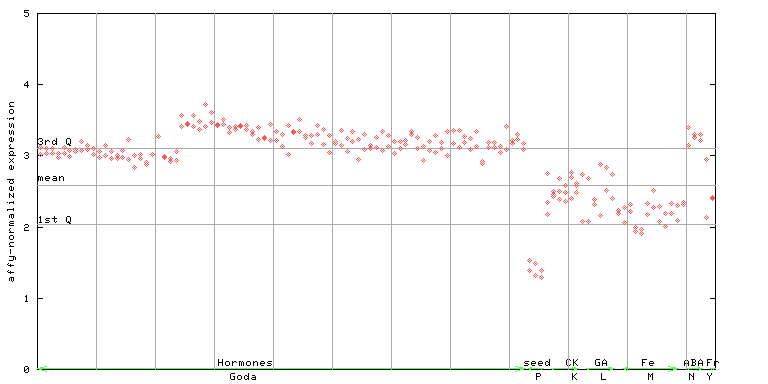
X axis is samples (xls file), and Y axis is log-expression. |
|||||||||||||||||||||||||||||||||||||||||||||||||


")
")
")
")
")
| Link to other DBs | ||
| Entrez Gene ID | 829573 |
|
| Refseq ID (protein) | NP_001329319.1 | |
| NP_001329320.1 | |
|
| NP_567962.1 | |
|
| NP_974679.1 | |
|
The preparation time of this page was 0.2 [sec].