[←][→] ath
| functional annotation | ||||||||||||||||||||||||||||||||||||||||||||||
| Function | hexokinase-like 3 |


|
||||||||||||||||||||||||||||||||||||||||||||
| GO BP |
|
|||||||||||||||||||||||||||||||||||||||||||||
| GO CC |
|
|||||||||||||||||||||||||||||||||||||||||||||
| GO MF |
|
|||||||||||||||||||||||||||||||||||||||||||||
| KEGG | ath00010 [list] [network] Glycolysis / Gluconeogenesis (116 genes) |  |
||||||||||||||||||||||||||||||||||||||||||||
| ath00051 [list] [network] Fructose and mannose metabolism (64 genes) | |
|||||||||||||||||||||||||||||||||||||||||||||
| ath00052 [list] [network] Galactose metabolism (57 genes) | |
|||||||||||||||||||||||||||||||||||||||||||||
| ath00500 [list] [network] Starch and sucrose metabolism (165 genes) | |
|||||||||||||||||||||||||||||||||||||||||||||
| ath00520 [list] [network] Amino sugar and nucleotide sugar metabolism (131 genes) | |
|||||||||||||||||||||||||||||||||||||||||||||
| ath01200 [list] [network] Carbon metabolism (273 genes) | |
|||||||||||||||||||||||||||||||||||||||||||||
| Protein | NP_195497.1 | |||||||||||||||||||||||||||||||||||||||||||||
| BLAST | NP_195497.1 | |||||||||||||||||||||||||||||||||||||||||||||
| Orthologous | [Ortholog page] LOC7465544 (ppo) LOC11408428 (mtr) LOC100796939 (gma) LOC100853210 (vvi) LOC100853826 (vvi) LOC101249034 (sly) LOC103835052 (bra) LOC103857280 (bra) | |||||||||||||||||||||||||||||||||||||||||||||
| Subcellular localization wolf |
|
|||||||||||||||||||||||||||||||||||||||||||||
| Subcellular localization TargetP |
|
|||||||||||||||||||||||||||||||||||||||||||||
| Gene coexpression | ||||||||||||||||||||||||||||||||||||||||||||||
| Network*for coexpressed genes |
||||||||||||||||||||||||||||||||||||||||||||||
|---|---|---|---|---|---|---|---|---|---|---|---|---|---|---|---|---|---|---|---|---|---|---|---|---|---|---|---|---|---|---|---|---|---|---|---|---|---|---|---|---|---|---|---|---|---|---|
| Coexpressed gene list |
[Coexpressed gene list for HKL3] | |||||||||||||||||||||||||||||||||||||||||||||
| Gene expression | ||||||||||||||||||||||||||||||||||||||||||||||
| All samples | [Expression pattern for all samples] | |||||||||||||||||||||||||||||||||||||||||||||
| AtGenExpress* (Development) |
253069_at
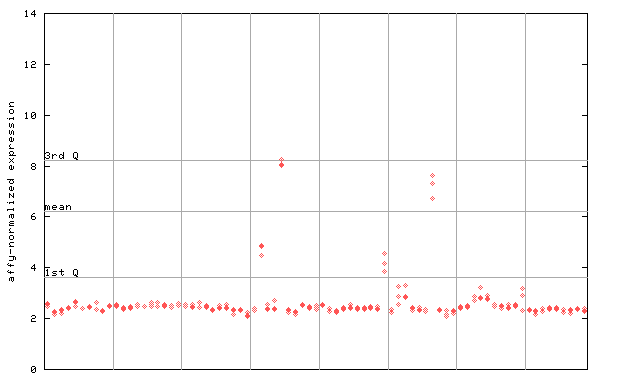
X axis is samples (pdf file), and Y axis is log2-expression. |
|||||||||||||||||||||||||||||||||||||||||||||
| AtGenExpress* (Stress) |
253069_at
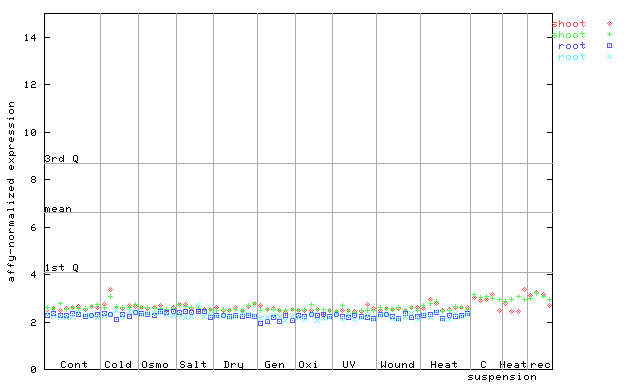
X axis is samples (pdf file), and Y axis is log2-expression. |
|||||||||||||||||||||||||||||||||||||||||||||
| AtGenExpress* (Hormone) |
253069_at
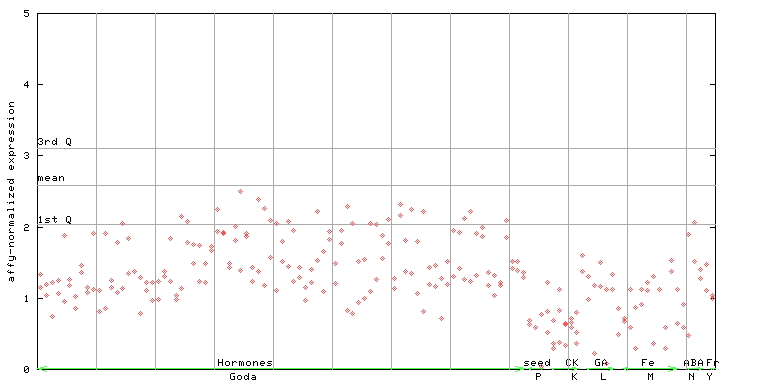
X axis is samples (xls file), and Y axis is log-expression. |
|||||||||||||||||||||||||||||||||||||||||||||

| Link to other DBs | ||
| Entrez Gene ID | 829940 |
|
| Refseq ID (protein) | NP_195497.1 | |
The preparation time of this page was 0.1 [sec].