[←][→] ath
| functional annotation | ||||||||||||||||||||||||||||||||||||||||||||||||||
| Function | geranylgeranyl reductase |


|
||||||||||||||||||||||||||||||||||||||||||||||||
| GO BP |
|
|||||||||||||||||||||||||||||||||||||||||||||||||
| GO CC |
|
|||||||||||||||||||||||||||||||||||||||||||||||||
| GO MF |
|
|||||||||||||||||||||||||||||||||||||||||||||||||
| KEGG | ath00900 [list] [network] Terpenoid backbone biosynthesis (60 genes) |  |
||||||||||||||||||||||||||||||||||||||||||||||||
| Protein | NP_195558.1 | |||||||||||||||||||||||||||||||||||||||||||||||||
| BLAST | NP_195558.1 | |||||||||||||||||||||||||||||||||||||||||||||||||
| Orthologous | [Ortholog page] LOC4330260 (osa) LOC100502542 (zma) LOC100788186 (gma) LOC100855133 (vvi) GGPS (sly) LOC103653897 (zma) LOC103850518 (bra) | |||||||||||||||||||||||||||||||||||||||||||||||||
| Subcellular localization wolf |
|
|||||||||||||||||||||||||||||||||||||||||||||||||
| Subcellular localization TargetP |
|
|||||||||||||||||||||||||||||||||||||||||||||||||
| Gene coexpression | ||||||||||||||||||||||||||||||||||||||||||||||||||
| Network*for coexpressed genes |
|
|||||||||||||||||||||||||||||||||||||||||||||||||
|---|---|---|---|---|---|---|---|---|---|---|---|---|---|---|---|---|---|---|---|---|---|---|---|---|---|---|---|---|---|---|---|---|---|---|---|---|---|---|---|---|---|---|---|---|---|---|---|---|---|---|
| Coexpressed gene list |
[Coexpressed gene list for GGR] | |||||||||||||||||||||||||||||||||||||||||||||||||
| Gene expression | ||||||||||||||||||||||||||||||||||||||||||||||||||
| All samples | [Expression pattern for all samples] | |||||||||||||||||||||||||||||||||||||||||||||||||
| AtGenExpress* (Development) |
252996_s_at
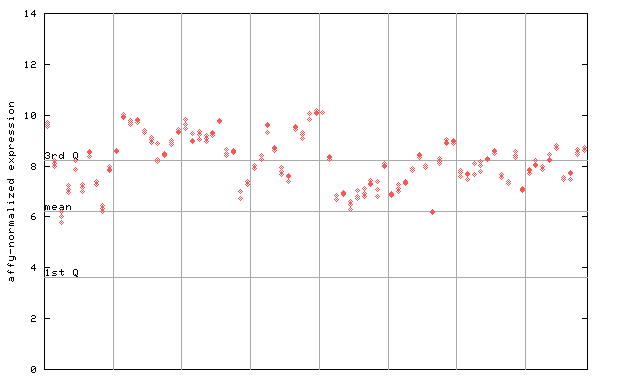
X axis is samples (pdf file), and Y axis is log2-expression. |
|||||||||||||||||||||||||||||||||||||||||||||||||
| AtGenExpress* (Stress) |
252996_s_at
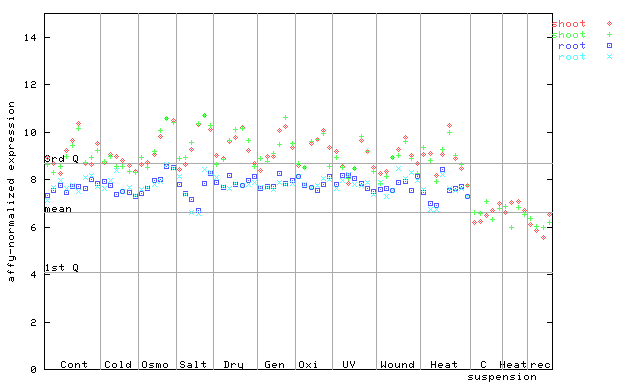
X axis is samples (pdf file), and Y axis is log2-expression. |
|||||||||||||||||||||||||||||||||||||||||||||||||
| AtGenExpress* (Hormone) |
252996_s_at
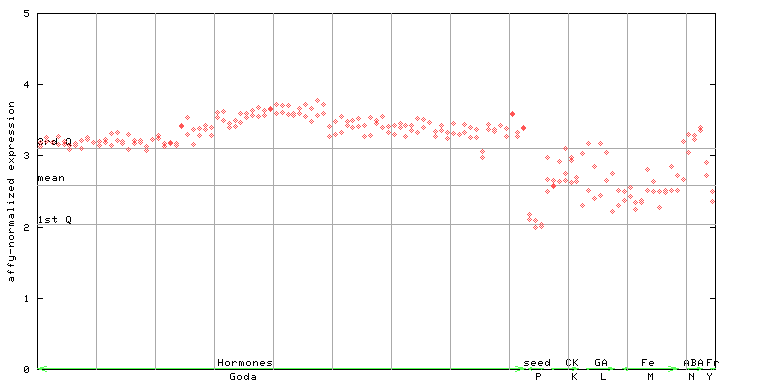
X axis is samples (xls file), and Y axis is log-expression. |
|||||||||||||||||||||||||||||||||||||||||||||||||


")
")
")
")
")
| Link to other DBs | ||
| Entrez Gene ID | 830002 |
|
| Refseq ID (protein) | NP_195558.1 | |
The preparation time of this page was 0.2 [sec].