[←][→] ath
| functional annotation | ||||||||||||||||||||||||||||||||||||
| Function | Transmembrane amino acid transporter family protein |


|
||||||||||||||||||||||||||||||||||
| GO BP |
|
|||||||||||||||||||||||||||||||||||
| GO CC |
|
|||||||||||||||||||||||||||||||||||
| GO MF |
|
|||||||||||||||||||||||||||||||||||
| KEGG | ||||||||||||||||||||||||||||||||||||
| Protein | NP_001331278.1 NP_195838.2 | |||||||||||||||||||||||||||||||||||
| BLAST | NP_001331278.1 NP_195838.2 | |||||||||||||||||||||||||||||||||||
| Orthologous | [Ortholog page] AT3G09330 (ath) AT3G09340 (ath) AT5G02170 (ath) LOC7468814 (ppo) LOC25498514 (mtr) LOC25498515 (mtr) LOC101255449 (sly) LOC103847472 (bra) LOC103855450 (bra) LOC103856818 (bra) LOC103860137 (bra) | |||||||||||||||||||||||||||||||||||
| Subcellular localization wolf |
|
|||||||||||||||||||||||||||||||||||
| Subcellular localization TargetP |
|
|||||||||||||||||||||||||||||||||||
| Gene coexpression | ||||||||||||||||||||||||||||||||||||
| Network*for coexpressed genes |
|
|||||||||||||||||||||||||||||||||||
|---|---|---|---|---|---|---|---|---|---|---|---|---|---|---|---|---|---|---|---|---|---|---|---|---|---|---|---|---|---|---|---|---|---|---|---|---|
| Coexpressed gene list |
[Coexpressed gene list for AT5G02180] | |||||||||||||||||||||||||||||||||||
| Gene expression | ||||||||||||||||||||||||||||||||||||
| All samples | [Expression pattern for all samples] | |||||||||||||||||||||||||||||||||||
| AtGenExpress* (Development) |
251024_at
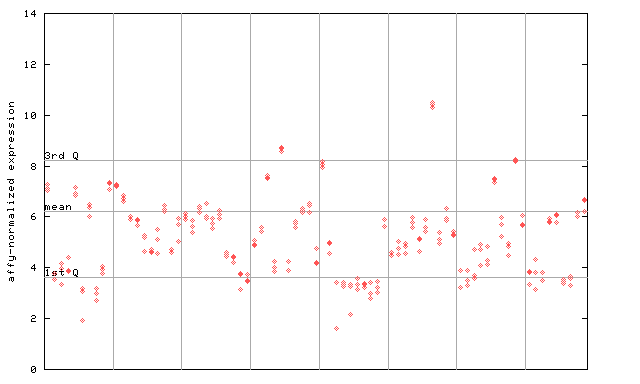
X axis is samples (pdf file), and Y axis is log2-expression. |
|||||||||||||||||||||||||||||||||||
| AtGenExpress* (Stress) |
251024_at
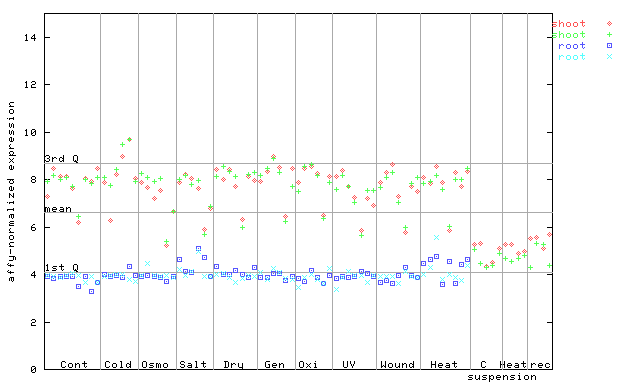
X axis is samples (pdf file), and Y axis is log2-expression. |
|||||||||||||||||||||||||||||||||||
| AtGenExpress* (Hormone) |
251024_at
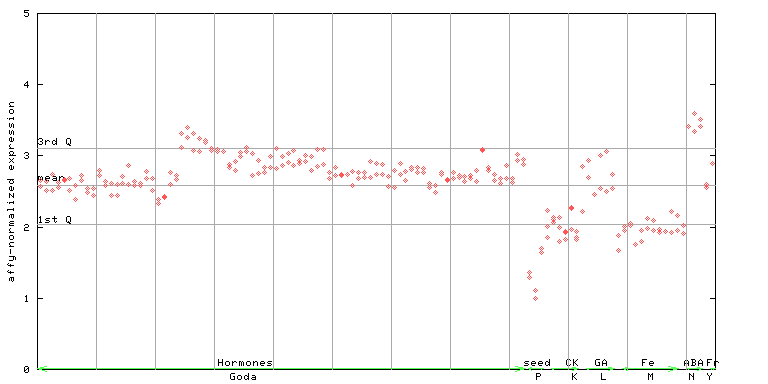
X axis is samples (xls file), and Y axis is log-expression. |
|||||||||||||||||||||||||||||||||||


| Link to other DBs | ||
| Entrez Gene ID | 831862 |
|
| Refseq ID (protein) | NP_001331278.1 | |
| NP_195838.2 | |
|
The preparation time of this page was 0.1 [sec].