[←][→] ath
| functional annotation | ||||||||||||||||||||||||||||||||||||||||||||
| Function | ABC2 homolog 12 |


|
||||||||||||||||||||||||||||||||||||||||||
| GO BP |
|
|||||||||||||||||||||||||||||||||||||||||||
| GO CC |
|
|||||||||||||||||||||||||||||||||||||||||||
| GO MF |
|
|||||||||||||||||||||||||||||||||||||||||||
| KEGG | ||||||||||||||||||||||||||||||||||||||||||||
| Protein | NP_196011.1 | |||||||||||||||||||||||||||||||||||||||||||
| BLAST | NP_196011.1 | |||||||||||||||||||||||||||||||||||||||||||
| Orthologous | [Ortholog page] LOC4335787 (osa) LOC25483811 (mtr) LOC100264781 (vvi) LOC100788075 (gma) ABCB24 (sly) LOC103646496 (zma) LOC103847350 (bra) | |||||||||||||||||||||||||||||||||||||||||||
| Subcellular localization wolf |
|
|||||||||||||||||||||||||||||||||||||||||||
| Subcellular localization TargetP |
|
|||||||||||||||||||||||||||||||||||||||||||
| Gene coexpression | ||||||||||||||||||||||||||||||||||||||||||||
| Network*for coexpressed genes |
|
|||||||||||||||||||||||||||||||||||||||||||
|---|---|---|---|---|---|---|---|---|---|---|---|---|---|---|---|---|---|---|---|---|---|---|---|---|---|---|---|---|---|---|---|---|---|---|---|---|---|---|---|---|---|---|---|---|
| Coexpressed gene list |
[Coexpressed gene list for ABCB29] | |||||||||||||||||||||||||||||||||||||||||||
| Gene expression | ||||||||||||||||||||||||||||||||||||||||||||
| All samples | [Expression pattern for all samples] | |||||||||||||||||||||||||||||||||||||||||||
| AtGenExpress* (Development) |
250885_at
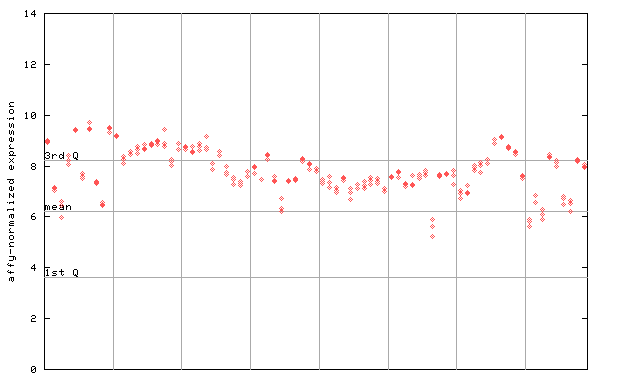
X axis is samples (pdf file), and Y axis is log2-expression. |
|||||||||||||||||||||||||||||||||||||||||||
| AtGenExpress* (Stress) |
250885_at
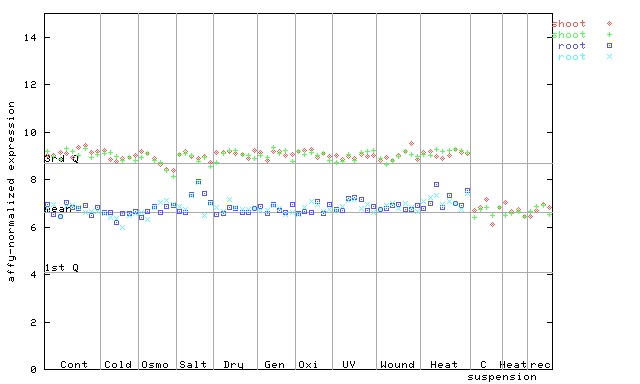
X axis is samples (pdf file), and Y axis is log2-expression. |
|||||||||||||||||||||||||||||||||||||||||||
| AtGenExpress* (Hormone) |
250885_at
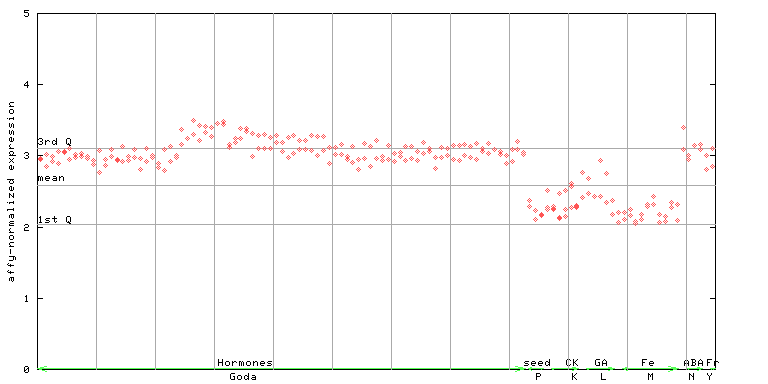
X axis is samples (xls file), and Y axis is log-expression. |
|||||||||||||||||||||||||||||||||||||||||||


")
| Link to other DBs | ||
| Entrez Gene ID | 830269 |
|
| Refseq ID (protein) | NP_196011.1 | |
The preparation time of this page was 0.2 [sec].