[←][→] ath
| functional annotation | ||||||||||||||||||||||||||||||||||||||
| Function | limit dextrinase |


|
||||||||||||||||||||||||||||||||||||
| GO BP |
|
|||||||||||||||||||||||||||||||||||||
| GO CC |
|
|||||||||||||||||||||||||||||||||||||
| GO MF |
|
|||||||||||||||||||||||||||||||||||||
| KEGG | ||||||||||||||||||||||||||||||||||||||
| Protein | NP_001330089.1 NP_196056.2 | |||||||||||||||||||||||||||||||||||||
| BLAST | NP_001330089.1 NP_196056.2 | |||||||||||||||||||||||||||||||||||||
| Orthologous | [Ortholog page] LOC542875 (tae) LOC4335042 (osa) LOC7468447 (ppo) LOC25484818 (mtr) LOC100780405 (gma) LOC101262883 (sly) LOC103847300 (bra) LOC123159322 (tae) LOC123166016 (tae) LOC123406986 (hvu) | |||||||||||||||||||||||||||||||||||||
| Subcellular localization wolf |
|
|||||||||||||||||||||||||||||||||||||
| Subcellular localization TargetP |
|
|||||||||||||||||||||||||||||||||||||
| Gene coexpression | ||||||||||||||||||||||||||||||||||||||
| Network*for coexpressed genes |
|
|||||||||||||||||||||||||||||||||||||
|---|---|---|---|---|---|---|---|---|---|---|---|---|---|---|---|---|---|---|---|---|---|---|---|---|---|---|---|---|---|---|---|---|---|---|---|---|---|---|
| Coexpressed gene list |
[Coexpressed gene list for LDA] | |||||||||||||||||||||||||||||||||||||
| Gene expression | ||||||||||||||||||||||||||||||||||||||
| All samples | [Expression pattern for all samples] | |||||||||||||||||||||||||||||||||||||
| AtGenExpress* (Development) |
245712_at
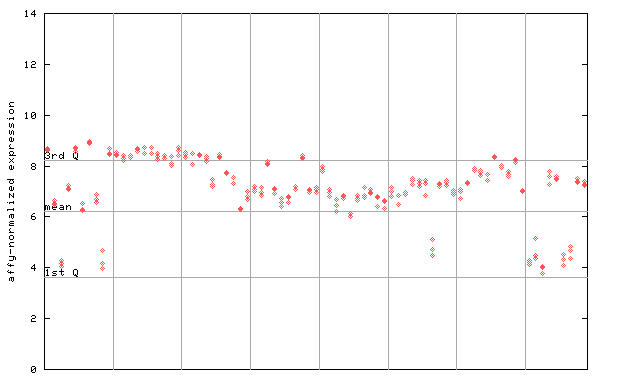
X axis is samples (pdf file), and Y axis is log2-expression. |
|||||||||||||||||||||||||||||||||||||
| AtGenExpress* (Stress) |
245712_at
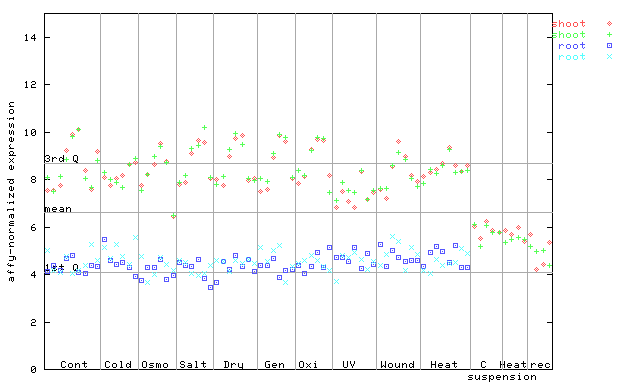
X axis is samples (pdf file), and Y axis is log2-expression. |
|||||||||||||||||||||||||||||||||||||
| AtGenExpress* (Hormone) |
245712_at
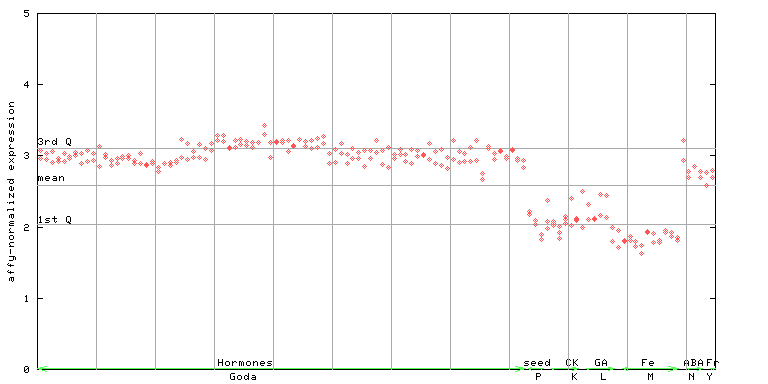
X axis is samples (xls file), and Y axis is log-expression. |
|||||||||||||||||||||||||||||||||||||


")
")
| Link to other DBs | ||
| Entrez Gene ID | 830315 |
|
| Refseq ID (protein) | NP_001330089.1 | |
| NP_196056.2 | |
|
The preparation time of this page was 0.1 [sec].