[←][→] ath
| functional annotation | |||||||||||||||||||||||||||||||||||||||
| Function | Plant invertase/pectin methylesterase inhibitor superfamily |


|
|||||||||||||||||||||||||||||||||||||
| GO BP |
|
||||||||||||||||||||||||||||||||||||||
| GO CC |
|
||||||||||||||||||||||||||||||||||||||
| GO MF |
|
||||||||||||||||||||||||||||||||||||||
| KEGG | ath00040 [list] [network] Pentose and glucuronate interconversions (96 genes) |  |
|||||||||||||||||||||||||||||||||||||
| Protein | NP_196116.1 | ||||||||||||||||||||||||||||||||||||||
| BLAST | NP_196116.1 | ||||||||||||||||||||||||||||||||||||||
| Orthologous | [Ortholog page] AT3G10720 (ath) LOC7469496 (ppo) LOC7486854 (ppo) LOC11405415 (mtr) LOC25501131 (mtr) LOC100262623 (vvi) LOC100816503 (gma) LOC101263475 (sly) LOC103847237 (bra) LOC103847348 (bra) LOC103855601 (bra) | ||||||||||||||||||||||||||||||||||||||
| Subcellular localization wolf |
|
||||||||||||||||||||||||||||||||||||||
| Subcellular localization TargetP |
|
||||||||||||||||||||||||||||||||||||||
| Gene coexpression | |||||||||||||||||||||||||||||||||||||||
| Network*for coexpressed genes |
|
||||||||||||||||||||||||||||||||||||||
|---|---|---|---|---|---|---|---|---|---|---|---|---|---|---|---|---|---|---|---|---|---|---|---|---|---|---|---|---|---|---|---|---|---|---|---|---|---|---|---|
| Coexpressed gene list |
[Coexpressed gene list for AT5G04970] | ||||||||||||||||||||||||||||||||||||||
| Gene expression | |||||||||||||||||||||||||||||||||||||||
| All samples | [Expression pattern for all samples] | ||||||||||||||||||||||||||||||||||||||
| AtGenExpress* (Development) |
250802_at
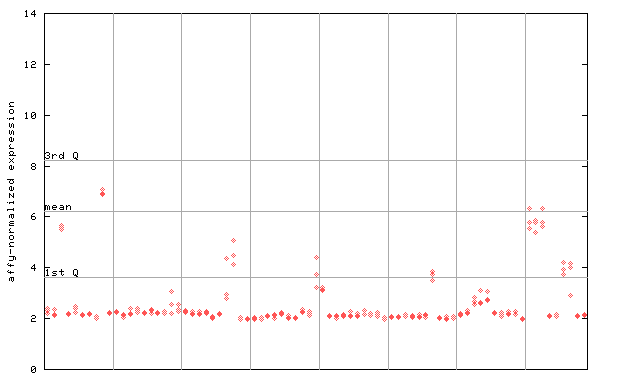
X axis is samples (pdf file), and Y axis is log2-expression. |
||||||||||||||||||||||||||||||||||||||
| AtGenExpress* (Stress) |
250802_at
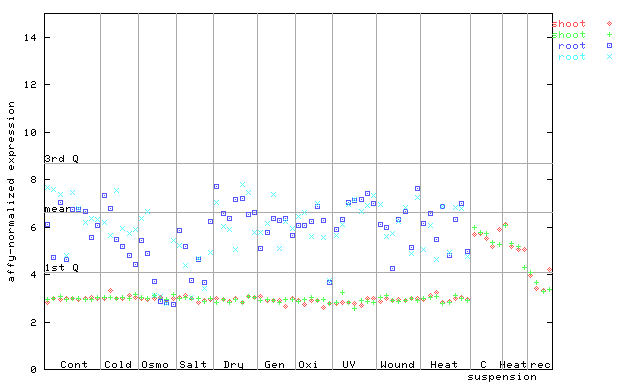
X axis is samples (pdf file), and Y axis is log2-expression. |
||||||||||||||||||||||||||||||||||||||
| AtGenExpress* (Hormone) |
250802_at
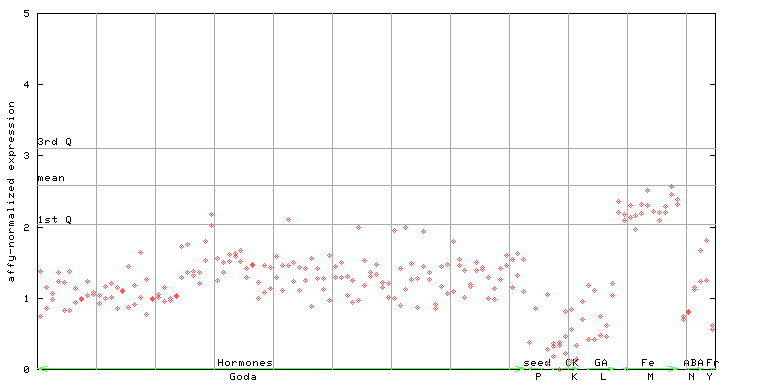
X axis is samples (xls file), and Y axis is log-expression. |
||||||||||||||||||||||||||||||||||||||


")
| Link to other DBs | ||
| Entrez Gene ID | 830379 |
|
| Refseq ID (protein) | NP_196116.1 | |
The preparation time of this page was 0.2 [sec].