[←][→] ath
| functional annotation | ||||||||||||||||||||||||||||||||||||||
| Function | FAD-linked oxidases family protein |


|
||||||||||||||||||||||||||||||||||||
| GO BP |
|
|||||||||||||||||||||||||||||||||||||
| GO CC |
|
|||||||||||||||||||||||||||||||||||||
| GO MF |
|
|||||||||||||||||||||||||||||||||||||
| KEGG | ath00620 [list] [network] Pyruvate metabolism (97 genes) |  |
||||||||||||||||||||||||||||||||||||
| Protein | NP_568170.1 | |||||||||||||||||||||||||||||||||||||
| BLAST | NP_568170.1 | |||||||||||||||||||||||||||||||||||||
| Orthologous | [Ortholog page] LOC7488058 (ppo) LOC9270233 (osa) LOC25499538 (mtr) LOC100803612 (gma) LOC101260691 (sly) LOC103846999 (bra) LOC123044937 (tae) LOC123052824 (tae) LOC123145879 (tae) LOC123188683 (tae) LOC123426876 (hvu) | |||||||||||||||||||||||||||||||||||||
| Subcellular localization wolf |
|
|||||||||||||||||||||||||||||||||||||
| Subcellular localization TargetP |
|
|||||||||||||||||||||||||||||||||||||
| Gene coexpression | ||||||||||||||||||||||||||||||||||||||
| Network*for coexpressed genes |
|
|||||||||||||||||||||||||||||||||||||
|---|---|---|---|---|---|---|---|---|---|---|---|---|---|---|---|---|---|---|---|---|---|---|---|---|---|---|---|---|---|---|---|---|---|---|---|---|---|---|
| Coexpressed gene list |
[Coexpressed gene list for AT5G06580] | |||||||||||||||||||||||||||||||||||||
| Gene expression | ||||||||||||||||||||||||||||||||||||||
| All samples | [Expression pattern for all samples] | |||||||||||||||||||||||||||||||||||||
| AtGenExpress* (Development) |
250691_at
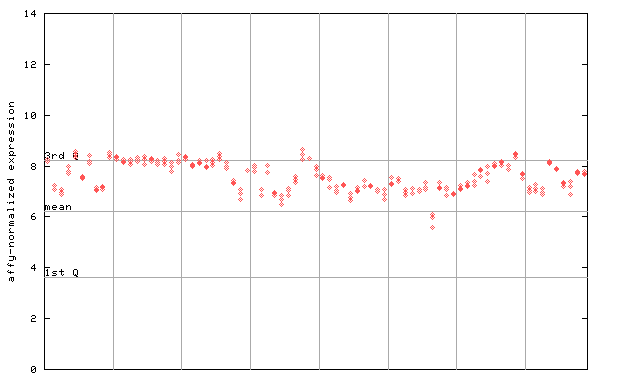
X axis is samples (pdf file), and Y axis is log2-expression. |
|||||||||||||||||||||||||||||||||||||
| AtGenExpress* (Stress) |
250691_at
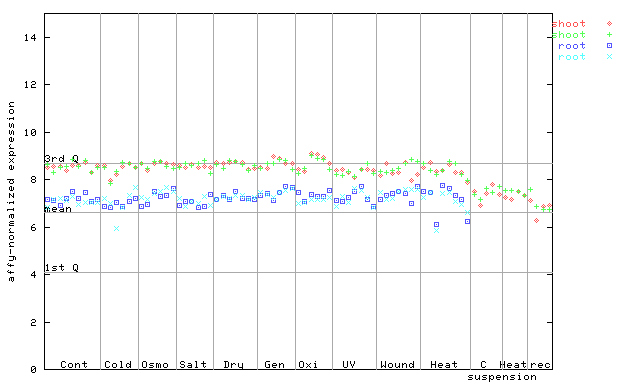
X axis is samples (pdf file), and Y axis is log2-expression. |
|||||||||||||||||||||||||||||||||||||
| AtGenExpress* (Hormone) |
250691_at
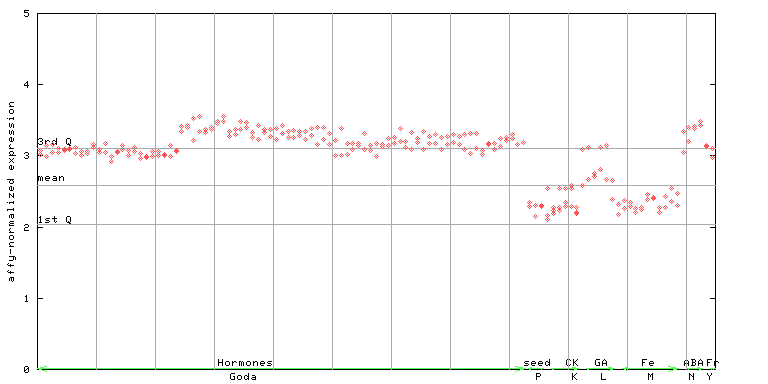
X axis is samples (xls file), and Y axis is log-expression. |
|||||||||||||||||||||||||||||||||||||


")
")
| Link to other DBs | ||
| Entrez Gene ID | 830546 |
|
| Refseq ID (protein) | NP_568170.1 | |
The preparation time of this page was 0.1 [sec].