[←][→] ath
| functional annotation | ||||||||||||||||||||||||||||||||||||||||||||
| Function | sucrose phosphate synthase 2F |


|
||||||||||||||||||||||||||||||||||||||||||
| GO BP |
|
|||||||||||||||||||||||||||||||||||||||||||
| GO CC |
|
|||||||||||||||||||||||||||||||||||||||||||
| GO MF |
|
|||||||||||||||||||||||||||||||||||||||||||
| KEGG | ath00500 [list] [network] Starch and sucrose metabolism (165 genes) |  |
||||||||||||||||||||||||||||||||||||||||||
| Protein | NP_196672.3 | |||||||||||||||||||||||||||||||||||||||||||
| BLAST | NP_196672.3 | |||||||||||||||||||||||||||||||||||||||||||
| Orthologous | [Ortholog page] sps (sly) SPS1F (ath) LOC4345220 (osa) LOC11446673 (mtr) LOC100127429 (gma) LOC100241955 (vvi) LOC100244135 (vvi) LOC100384028 (zma) LOC100798787 (gma) LOC101055611 (sly) LOC103845691 (bra) LOC103851339 (bra) LOC103855902 (bra) LOC103874391 (bra) | |||||||||||||||||||||||||||||||||||||||||||
| Subcellular localization wolf |
|
|||||||||||||||||||||||||||||||||||||||||||
| Subcellular localization TargetP |
|
|||||||||||||||||||||||||||||||||||||||||||
| Gene coexpression | ||||||||||||||||||||||||||||||||||||||||||||
| Network*for coexpressed genes |
|
|||||||||||||||||||||||||||||||||||||||||||
|---|---|---|---|---|---|---|---|---|---|---|---|---|---|---|---|---|---|---|---|---|---|---|---|---|---|---|---|---|---|---|---|---|---|---|---|---|---|---|---|---|---|---|---|---|
| Coexpressed gene list |
[Coexpressed gene list for SPS2F] | |||||||||||||||||||||||||||||||||||||||||||
| Gene expression | ||||||||||||||||||||||||||||||||||||||||||||
| All samples | [Expression pattern for all samples] | |||||||||||||||||||||||||||||||||||||||||||
| AtGenExpress* (Development) |
245904_at
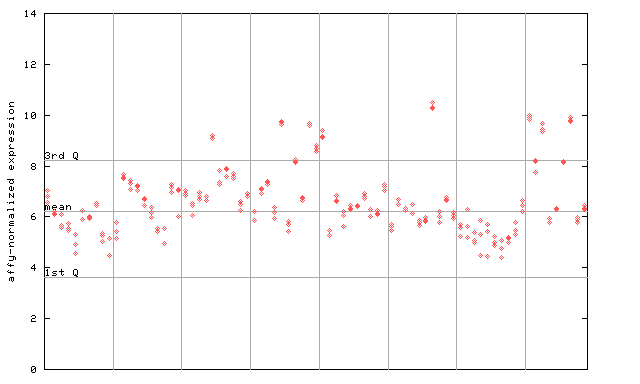
X axis is samples (pdf file), and Y axis is log2-expression. |
|||||||||||||||||||||||||||||||||||||||||||
| AtGenExpress* (Stress) |
245904_at
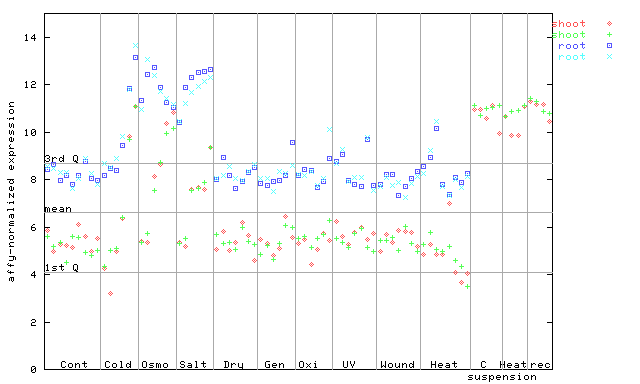
X axis is samples (pdf file), and Y axis is log2-expression. |
|||||||||||||||||||||||||||||||||||||||||||
| AtGenExpress* (Hormone) |
245904_at
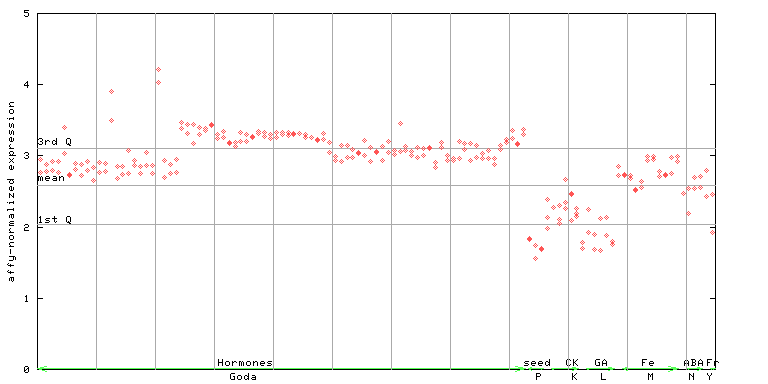
X axis is samples (xls file), and Y axis is log-expression. |
|||||||||||||||||||||||||||||||||||||||||||


")
| Link to other DBs | ||
| Entrez Gene ID | 830979 |
|
| Refseq ID (protein) | NP_196672.3 | |
The preparation time of this page was 0.2 [sec].