[←][→] ath
| functional annotation | |||||||||||||||||||||||||||||||||||||||||||||||||||
| Function | Glycosyl hydrolases family 31 protein |


|
|||||||||||||||||||||||||||||||||||||||||||||||||
| GO BP |
|
||||||||||||||||||||||||||||||||||||||||||||||||||
| GO CC |
|
||||||||||||||||||||||||||||||||||||||||||||||||||
| GO MF |
|
||||||||||||||||||||||||||||||||||||||||||||||||||
| KEGG | ath00052 [list] [network] Galactose metabolism (57 genes) |  |
|||||||||||||||||||||||||||||||||||||||||||||||||
| ath00500 [list] [network] Starch and sucrose metabolism (165 genes) | |
||||||||||||||||||||||||||||||||||||||||||||||||||
| Protein | NP_196733.1 | ||||||||||||||||||||||||||||||||||||||||||||||||||
| BLAST | NP_196733.1 | ||||||||||||||||||||||||||||||||||||||||||||||||||
| Orthologous | [Ortholog page] LOC4341824 (osa) LOC4341833 (osa) LOC7455044 (ppo) LOC7491387 (ppo) LOC100259567 (vvi) LOC100264744 (vvi) LOC100777498 (gma) LOC100802518 (gma) LOC101254891 (sly) LOC101264994 (sly) LOC103629642 (zma) LOC103855926 (bra) LOC112419479 (mtr) LOC112419480 (mtr) LOC112419481 (mtr) | ||||||||||||||||||||||||||||||||||||||||||||||||||
| Subcellular localization wolf |
|
||||||||||||||||||||||||||||||||||||||||||||||||||
| Subcellular localization TargetP |
|
||||||||||||||||||||||||||||||||||||||||||||||||||
| Gene coexpression | |||||||||||||||||||||||||||||||||||||||||||||||||||
| Network*for coexpressed genes |
|
||||||||||||||||||||||||||||||||||||||||||||||||||
|---|---|---|---|---|---|---|---|---|---|---|---|---|---|---|---|---|---|---|---|---|---|---|---|---|---|---|---|---|---|---|---|---|---|---|---|---|---|---|---|---|---|---|---|---|---|---|---|---|---|---|---|
| Coexpressed gene list |
[Coexpressed gene list for AT5G11720] | ||||||||||||||||||||||||||||||||||||||||||||||||||
| Gene expression | |||||||||||||||||||||||||||||||||||||||||||||||||||
| All samples | [Expression pattern for all samples] | ||||||||||||||||||||||||||||||||||||||||||||||||||
| AtGenExpress* (Development) |
250336_at
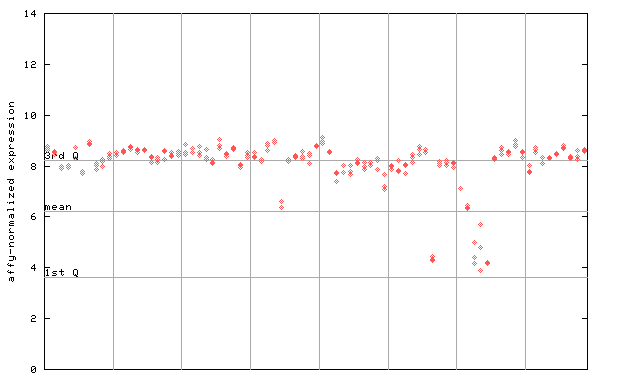
X axis is samples (pdf file), and Y axis is log2-expression. |
||||||||||||||||||||||||||||||||||||||||||||||||||
| AtGenExpress* (Stress) |
250336_at
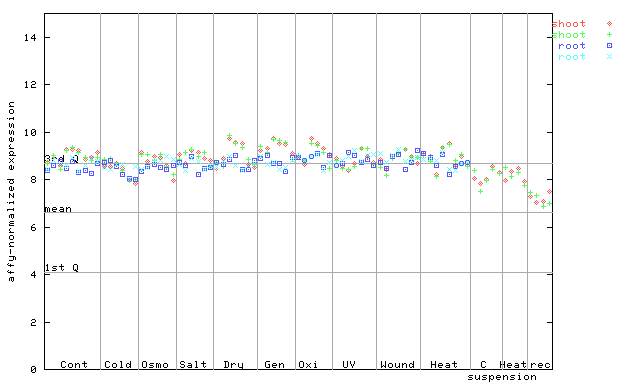
X axis is samples (pdf file), and Y axis is log2-expression. |
||||||||||||||||||||||||||||||||||||||||||||||||||
| AtGenExpress* (Hormone) |
250336_at
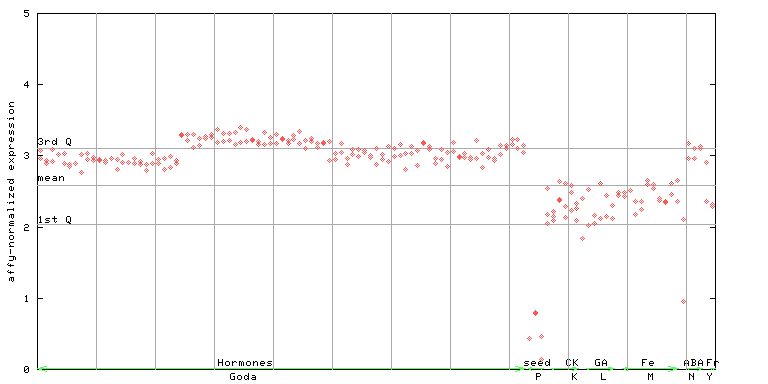
X axis is samples (xls file), and Y axis is log-expression. |
||||||||||||||||||||||||||||||||||||||||||||||||||


")
")
")
")
| Link to other DBs | ||
| Entrez Gene ID | 831044 |
|
| Refseq ID (protein) | NP_196733.1 | |
The preparation time of this page was 0.2 [sec].