[←][→] ath
| functional annotation | |||||||||||||||||||||||||||||||||||||||
| Function | alpha-N-acetylglucosaminidase family / NAGLU family |


|
|||||||||||||||||||||||||||||||||||||
| GO BP |
|
||||||||||||||||||||||||||||||||||||||
| GO CC |
|
||||||||||||||||||||||||||||||||||||||
| GO MF |
|
||||||||||||||||||||||||||||||||||||||
| KEGG | ath00531 [list] [network] Glycosaminoglycan degradation (7 genes) |  |
|||||||||||||||||||||||||||||||||||||
| Protein | NP_001329969.1 NP_196873.1 | ||||||||||||||||||||||||||||||||||||||
| BLAST | NP_001329969.1 NP_196873.1 | ||||||||||||||||||||||||||||||||||||||
| Orthologous | [Ortholog page] LOC7467345 (ppo) LOC9270735 (osa) LOC11410414 (mtr) LOC25489560 (mtr) LOC100192858 (zma) LOC100246821 (vvi) LOC100261888 (vvi) LOC100791160 (gma) LOC100805725 (gma) LOC101253829 (sly) LOC103639124 (zma) LOC103850890 (bra) | ||||||||||||||||||||||||||||||||||||||
| Subcellular localization wolf |
|
||||||||||||||||||||||||||||||||||||||
| Subcellular localization TargetP |
|
||||||||||||||||||||||||||||||||||||||
| Gene coexpression | |||||||||||||||||||||||||||||||||||||||
| Network*for coexpressed genes |
|
||||||||||||||||||||||||||||||||||||||
|---|---|---|---|---|---|---|---|---|---|---|---|---|---|---|---|---|---|---|---|---|---|---|---|---|---|---|---|---|---|---|---|---|---|---|---|---|---|---|---|
| Coexpressed gene list |
[Coexpressed gene list for CYL1] | ||||||||||||||||||||||||||||||||||||||
| Gene expression | |||||||||||||||||||||||||||||||||||||||
| All samples | [Expression pattern for all samples] | ||||||||||||||||||||||||||||||||||||||
| AtGenExpress* (Development) |
250245_at
X axis is samples (pdf file), and Y axis is log2-expression. |
||||||||||||||||||||||||||||||||||||||
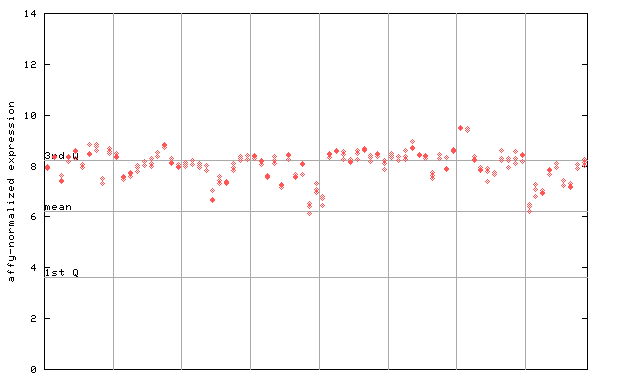
| AtGenExpress* (Stress) |
250245_at
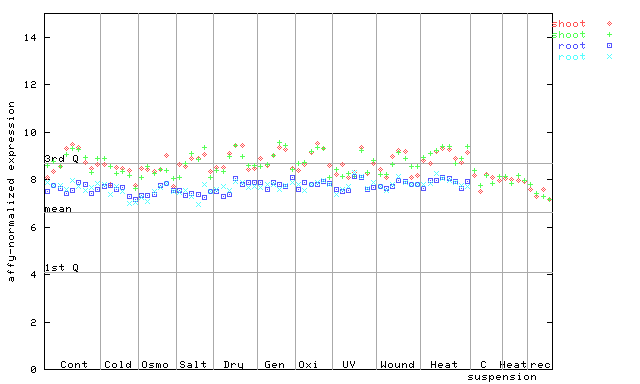
X axis is samples (pdf file), and Y axis is log2-expression. |
||||||||||||||||||||||||||||||||||||||
| AtGenExpress* (Hormone) |
250245_at
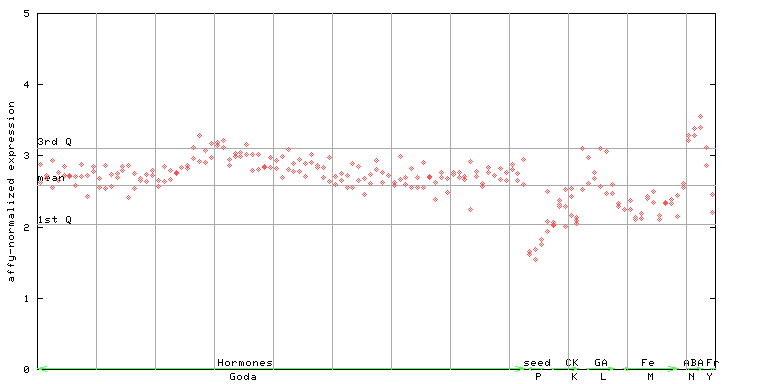
X axis is samples (xls file), and Y axis is log-expression. |
||||||||||||||||||||||||||||||||||||||


")
| Link to other DBs | ||
| Entrez Gene ID | 831214 |
|
| Refseq ID (protein) | NP_001329969.1 | |
| NP_196873.1 | |
|
The preparation time of this page was 0.3 [sec].