[←][→] ath
| functional annotation | |||||||||||||||||||||||||||||||||||||||
| Function | Core-2/I-branching beta-1,6-N-acetylglucosaminyltransferase family protein |


|
|||||||||||||||||||||||||||||||||||||
| GO BP |
|
||||||||||||||||||||||||||||||||||||||
| GO CC |
|
||||||||||||||||||||||||||||||||||||||
| GO MF |
|
||||||||||||||||||||||||||||||||||||||
| KEGG | |||||||||||||||||||||||||||||||||||||||
| Protein | NP_001330280.1 NP_001330281.1 NP_196959.2 NP_850819.1 | ||||||||||||||||||||||||||||||||||||||
| BLAST | NP_001330280.1 NP_001330281.1 NP_196959.2 NP_850819.1 | ||||||||||||||||||||||||||||||||||||||
| Orthologous | [Ortholog page] LOC4337935 (osa) LOC7487859 (ppo) LOC11429121 (mtr) LOC100259507 (vvi) LOC100276060 (zma) LOC100776366 (gma) LOC100791308 (gma) LOC101257325 (sly) LOC103846479 (bra) | ||||||||||||||||||||||||||||||||||||||
| Subcellular localization wolf |
|
||||||||||||||||||||||||||||||||||||||
| Subcellular localization TargetP |
|
||||||||||||||||||||||||||||||||||||||
| Gene coexpression | |||||||||||||||||||||||||||||||||||||||
| Network*for coexpressed genes |
|
||||||||||||||||||||||||||||||||||||||
|---|---|---|---|---|---|---|---|---|---|---|---|---|---|---|---|---|---|---|---|---|---|---|---|---|---|---|---|---|---|---|---|---|---|---|---|---|---|---|---|
| Coexpressed gene list |
[Coexpressed gene list for AT5G14550] | ||||||||||||||||||||||||||||||||||||||
| Gene expression | |||||||||||||||||||||||||||||||||||||||
| All samples | [Expression pattern for all samples] | ||||||||||||||||||||||||||||||||||||||
| AtGenExpress* (Development) |
250194_at
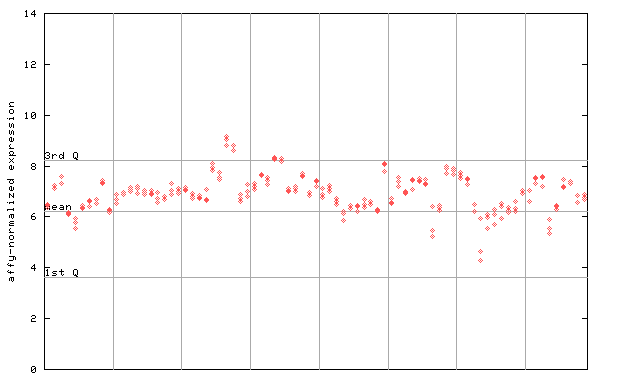
X axis is samples (pdf file), and Y axis is log2-expression. |
||||||||||||||||||||||||||||||||||||||
| AtGenExpress* (Stress) |
250194_at
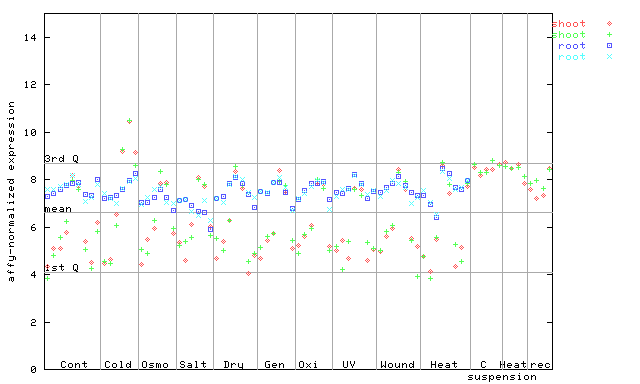
X axis is samples (pdf file), and Y axis is log2-expression. |
||||||||||||||||||||||||||||||||||||||
| AtGenExpress* (Hormone) |
250194_at
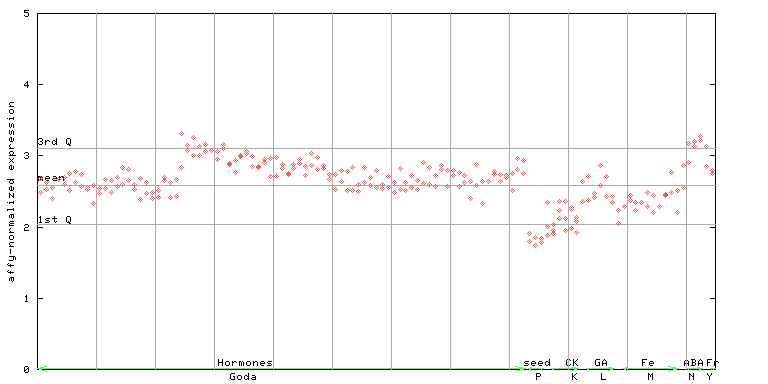
X axis is samples (xls file), and Y axis is log-expression. |
||||||||||||||||||||||||||||||||||||||


")
| Link to other DBs | ||
| Entrez Gene ID | 831306 |
|
| Refseq ID (protein) | NP_001330280.1 | |
| NP_001330281.1 | |
|
| NP_196959.2 | |
|
| NP_850819.1 | |
|
The preparation time of this page was 0.2 [sec].