[←][→] ath
| functional annotation | ||||||||
| Function | GDSL-motif lipase 7 |


|
||||||
| GO BP |
|
|||||||
| GO CC |
|
|||||||
| GO MF |
|
|||||||
| KEGG | ||||||||
| Protein | NP_001332581.1 NP_001332582.1 NP_568318.1 | |||||||
| BLAST | NP_001332581.1 NP_001332582.1 NP_568318.1 | |||||||
| Orthologous | [Ortholog page] LOC100254855 (vvi) LOC103851001 (bra) LOC103856158 (bra) | |||||||
| Subcellular localization wolf |
|
|||||||
| Subcellular localization TargetP |
|
|||||||
| Gene coexpression | ||||||||
| Network*for coexpressed genes |
||||||||
|---|---|---|---|---|---|---|---|---|
| Coexpressed gene list |
[Coexpressed gene list for GLIP7] | |||||||
| Gene expression | ||||||||
| All samples | [Expression pattern for all samples] | |||||||
| AtGenExpress* (Development) |
246526_at
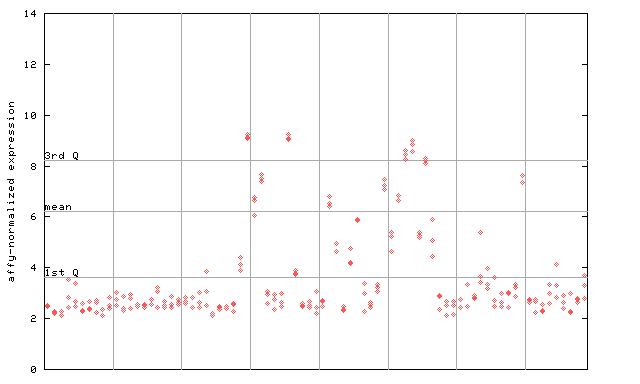
X axis is samples (pdf file), and Y axis is log2-expression. |
|||||||
| AtGenExpress* (Stress) |
246526_at
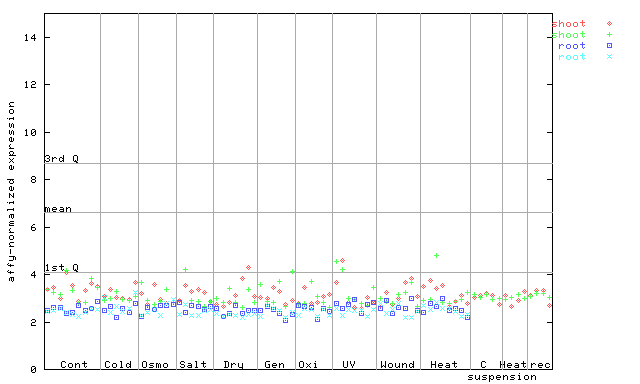
X axis is samples (pdf file), and Y axis is log2-expression. |
|||||||
| AtGenExpress* (Hormone) |
246526_at
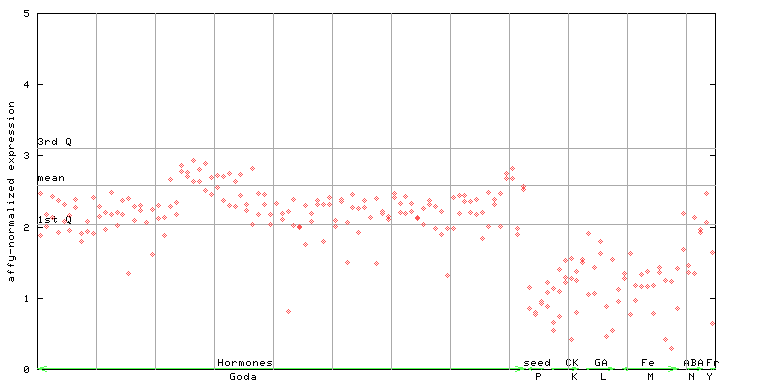
X axis is samples (xls file), and Y axis is log-expression. |
|||||||

| Link to other DBs | ||
| Entrez Gene ID | 831427 |
|
| Refseq ID (protein) | NP_001332581.1 | |
| NP_001332582.1 | |
|
| NP_568318.1 | |
|
The preparation time of this page was 0.1 [sec].