[←][→] ath
| functional annotation | |||||||||||||||||||||||||||||||||||||||
| Function | plastidic GLC translocator |


|
|||||||||||||||||||||||||||||||||||||
| GO BP |
|
||||||||||||||||||||||||||||||||||||||
| GO CC |
|
||||||||||||||||||||||||||||||||||||||
| GO MF |
|
||||||||||||||||||||||||||||||||||||||
| KEGG | |||||||||||||||||||||||||||||||||||||||
| Protein | NP_568328.1 NP_850828.1 NP_974787.1 | ||||||||||||||||||||||||||||||||||||||
| BLAST | NP_568328.1 NP_850828.1 NP_974787.1 | ||||||||||||||||||||||||||||||||||||||
| Orthologous | [Ortholog page] LOC4325804 (osa) LOC11437466 (mtr) LOC18097611 (ppo) LOC18099475 (ppo) LOC25495641 (mtr) LOC100818304 (gma) LOC100818957 (gma) pGlcT1 (sly) LOC103846351 (bra) LOC103856184 (bra) LOC123059915 (tae) LOC123076930 (tae) LOC123442552 (hvu) | ||||||||||||||||||||||||||||||||||||||
| Subcellular localization wolf |
|
||||||||||||||||||||||||||||||||||||||
| Subcellular localization TargetP |
|
||||||||||||||||||||||||||||||||||||||
| Gene coexpression | |||||||||||||||||||||||||||||||||||||||
| Network*for coexpressed genes |
|
||||||||||||||||||||||||||||||||||||||
|---|---|---|---|---|---|---|---|---|---|---|---|---|---|---|---|---|---|---|---|---|---|---|---|---|---|---|---|---|---|---|---|---|---|---|---|---|---|---|---|
| Coexpressed gene list |
[Coexpressed gene list for PGLCT] | ||||||||||||||||||||||||||||||||||||||
| Gene expression | |||||||||||||||||||||||||||||||||||||||
| All samples | [Expression pattern for all samples] | ||||||||||||||||||||||||||||||||||||||
| AtGenExpress* (Development) |
246508_at
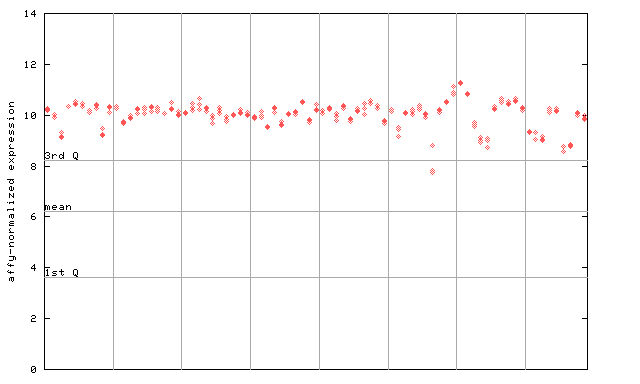
X axis is samples (pdf file), and Y axis is log2-expression. |
||||||||||||||||||||||||||||||||||||||
| AtGenExpress* (Stress) |
246508_at
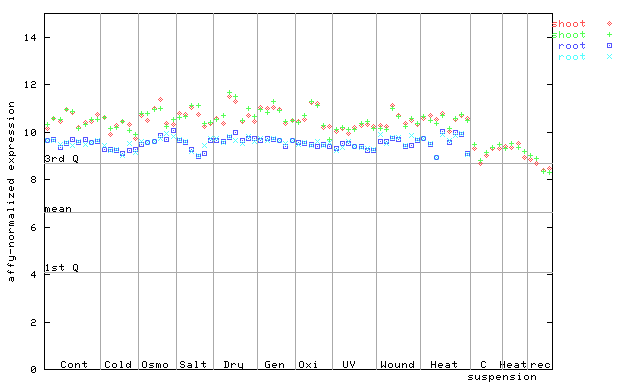
X axis is samples (pdf file), and Y axis is log2-expression. |
||||||||||||||||||||||||||||||||||||||
| AtGenExpress* (Hormone) |
246508_at
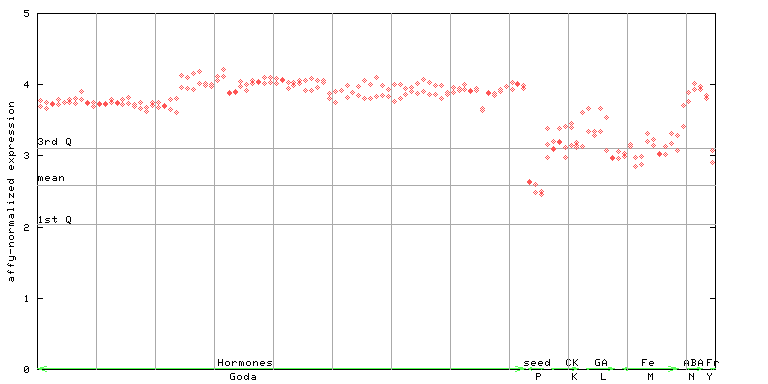
X axis is samples (xls file), and Y axis is log-expression. |
||||||||||||||||||||||||||||||||||||||


")
| Link to other DBs | ||
| Entrez Gene ID | 831472 |
|
| Refseq ID (protein) | NP_568328.1 | |
| NP_850828.1 | |
|
| NP_974787.1 | |
|
The preparation time of this page was 0.1 [sec].