[←][→] ath
| functional annotation | ||||||||||||||||||||||||||||||||||||||||||||||
| Function | Avirulence induced gene (AIG1) family protein |


|
||||||||||||||||||||||||||||||||||||||||||||
| GO BP |
|
|||||||||||||||||||||||||||||||||||||||||||||
| GO CC |
|
|||||||||||||||||||||||||||||||||||||||||||||
| GO MF |
|
|||||||||||||||||||||||||||||||||||||||||||||
| KEGG | ||||||||||||||||||||||||||||||||||||||||||||||
| Protein | NP_001031911.1 NP_001031912.1 NP_001318609.1 NP_001329949.1 NP_197530.2 | |||||||||||||||||||||||||||||||||||||||||||||
| BLAST | NP_001031911.1 NP_001031912.1 NP_001318609.1 NP_001329949.1 NP_197530.2 | |||||||||||||||||||||||||||||||||||||||||||||
| Orthologous | [Ortholog page] LOC4351723 (osa) LOC11438802 (mtr) LOC18099911 (ppo) LOC18111077 (ppo) LOC100796846 (gma) LOC100805258 (gma) LOC101260739 (sly) LOC103845688 (bra) LOC123102832 (tae) LOC123110901 (tae) LOC123119967 (tae) LOC123395503 (hvu) | |||||||||||||||||||||||||||||||||||||||||||||
| Subcellular localization wolf |
|
|||||||||||||||||||||||||||||||||||||||||||||
| Subcellular localization TargetP |
|
|||||||||||||||||||||||||||||||||||||||||||||
| Gene coexpression | ||||||||||||||||||||||||||||||||||||||||||||||
| Network*for coexpressed genes |
|
|||||||||||||||||||||||||||||||||||||||||||||
|---|---|---|---|---|---|---|---|---|---|---|---|---|---|---|---|---|---|---|---|---|---|---|---|---|---|---|---|---|---|---|---|---|---|---|---|---|---|---|---|---|---|---|---|---|---|---|
| Coexpressed gene list |
[Coexpressed gene list for Toc90] | |||||||||||||||||||||||||||||||||||||||||||||
| Gene expression | ||||||||||||||||||||||||||||||||||||||||||||||
| All samples | [Expression pattern for all samples] | |||||||||||||||||||||||||||||||||||||||||||||
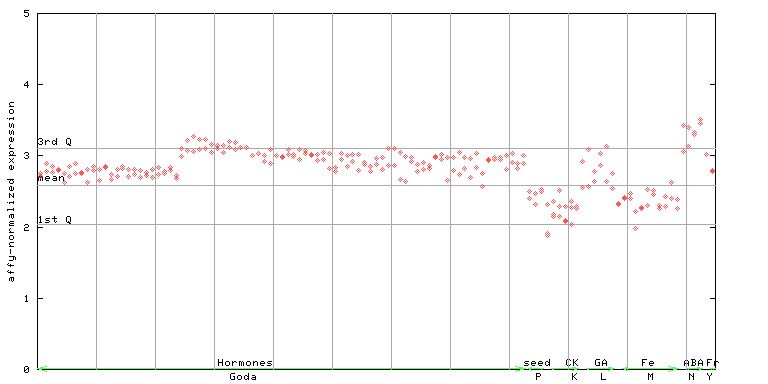
| AtGenExpress* (Development) |
246115_at
X axis is samples (pdf file), and Y axis is log2-expression. |
|||||||||||||||||||||||||||||||||||||||||||||
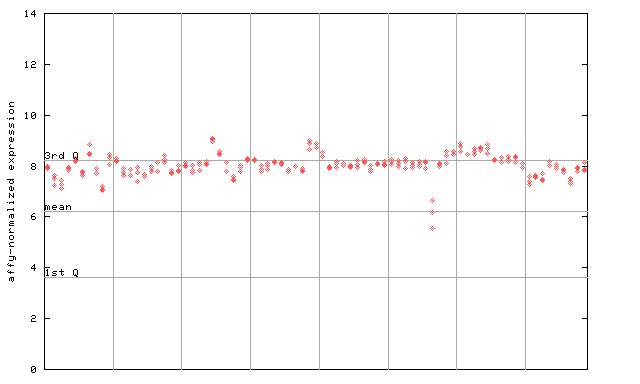
| AtGenExpress* (Stress) |
246115_at
X axis is samples (pdf file), and Y axis is log2-expression. |
|||||||||||||||||||||||||||||||||||||||||||||
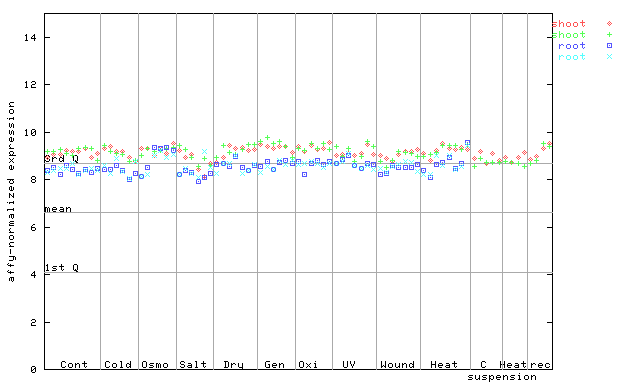
| AtGenExpress* (Hormone) |
246115_at
X axis is samples (xls file), and Y axis is log-expression. |
|||||||||||||||||||||||||||||||||||||||||||||


")
")
")
")
| Link to other DBs | ||
| Entrez Gene ID | 832152 |
|
| Refseq ID (protein) | NP_001031911.1 | |
| NP_001031912.1 | |
|
| NP_001318609.1 | |
|
| NP_001329949.1 | |
|
| NP_197530.2 | |
|
The preparation time of this page was 0.1 [sec].