[←][→] ath
| functional annotation | |||||||||||||||||||||||||||||||||||||||||||||||||||
| Function | RING/U-box superfamily protein |


|
|||||||||||||||||||||||||||||||||||||||||||||||||
| GO BP |
|
||||||||||||||||||||||||||||||||||||||||||||||||||
| GO CC |
|
||||||||||||||||||||||||||||||||||||||||||||||||||
| GO MF |
|
||||||||||||||||||||||||||||||||||||||||||||||||||
| KEGG | |||||||||||||||||||||||||||||||||||||||||||||||||||
| Protein | NP_568404.1 | ||||||||||||||||||||||||||||||||||||||||||||||||||
| BLAST | NP_568404.1 | ||||||||||||||||||||||||||||||||||||||||||||||||||
| Orthologous | [Ortholog page] AT3G43430 (ath) LOC7492274 (ppo) LOC11423860 (mtr) LOC18107730 (ppo) LOC100306203 (gma) LOC103845635 (bra) LOC103851384 (bra) LOC103856470 (bra) LOC111138523 (gma) | ||||||||||||||||||||||||||||||||||||||||||||||||||
| Subcellular localization wolf |
|
||||||||||||||||||||||||||||||||||||||||||||||||||
| Subcellular localization TargetP |
|
||||||||||||||||||||||||||||||||||||||||||||||||||
| Gene coexpression | |||||||||||||||||||||||||||||||||||||||||||||||||||
| Network*for coexpressed genes |
|
||||||||||||||||||||||||||||||||||||||||||||||||||
|---|---|---|---|---|---|---|---|---|---|---|---|---|---|---|---|---|---|---|---|---|---|---|---|---|---|---|---|---|---|---|---|---|---|---|---|---|---|---|---|---|---|---|---|---|---|---|---|---|---|---|---|
| Coexpressed gene list |
[Coexpressed gene list for AT5G20885] | ||||||||||||||||||||||||||||||||||||||||||||||||||
| Gene expression | |||||||||||||||||||||||||||||||||||||||||||||||||||
| All samples | [Expression pattern for all samples] | ||||||||||||||||||||||||||||||||||||||||||||||||||
| AtGenExpress* (Development) |
246135_at
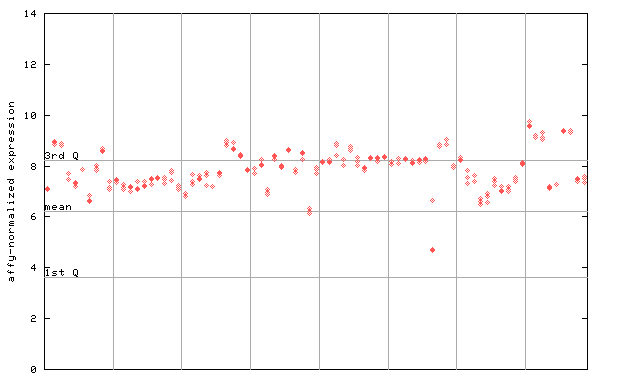
X axis is samples (pdf file), and Y axis is log2-expression. |
||||||||||||||||||||||||||||||||||||||||||||||||||
| AtGenExpress* (Stress) |
246135_at
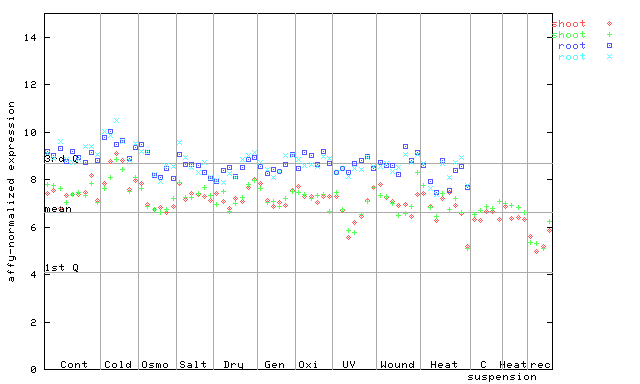
X axis is samples (pdf file), and Y axis is log2-expression. |
||||||||||||||||||||||||||||||||||||||||||||||||||
| AtGenExpress* (Hormone) |
246135_at
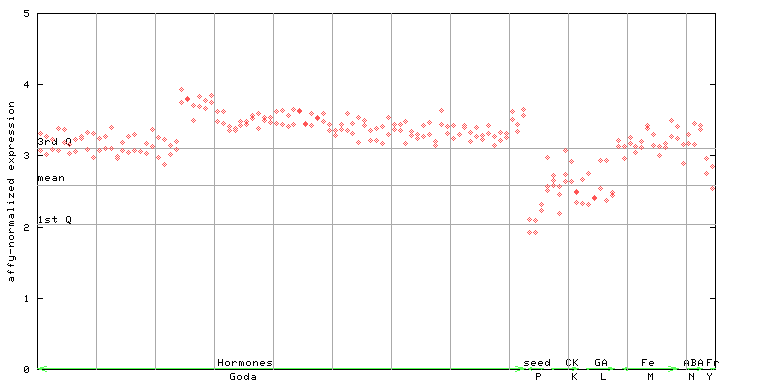
X axis is samples (xls file), and Y axis is log-expression. |
||||||||||||||||||||||||||||||||||||||||||||||||||

")
")
")
")
| Link to other DBs | ||
| Entrez Gene ID | 832212 |
|
| Refseq ID (protein) | NP_568404.1 | |
The preparation time of this page was 0.1 [sec].