[←][→] ath
| functional annotation | ||||||||||||||||||||||||||||||||||||||||||||||
| Function | Succinyl-CoA ligase, alpha subunit |


|
||||||||||||||||||||||||||||||||||||||||||||
| GO BP |
|
|||||||||||||||||||||||||||||||||||||||||||||
| GO CC |
|
|||||||||||||||||||||||||||||||||||||||||||||
| GO MF |
|
|||||||||||||||||||||||||||||||||||||||||||||
| KEGG | ath00020 [list] [network] Citrate cycle (TCA cycle) (64 genes) |  |
||||||||||||||||||||||||||||||||||||||||||||
| ath00640 [list] [network] Propanoate metabolism (41 genes) | |
|||||||||||||||||||||||||||||||||||||||||||||
| ath01200 [list] [network] Carbon metabolism (273 genes) | |
|||||||||||||||||||||||||||||||||||||||||||||
| Protein | NP_001119263.1 NP_001331781.1 NP_197716.1 | |||||||||||||||||||||||||||||||||||||||||||||
| BLAST | NP_001119263.1 NP_001331781.1 NP_197716.1 | |||||||||||||||||||||||||||||||||||||||||||||
| Orthologous | [Ortholog page] SCOA (sly) LOC543943 (sly) AT5G08300 (ath) LOC4343710 (osa) LOC7454042 (ppo) LOC7486370 (ppo) LOC11414653 (mtr) LOC18103612 (ppo) LOC100782001 (gma) LOC100815484 (gma) LOC103847149 (bra) LOC103850689 (bra) LOC103855774 (bra) LOC103860515 (bra) LOC123044441 (tae) LOC123052304 (tae) LOC123188104 (tae) LOC123425576 (hvu) | |||||||||||||||||||||||||||||||||||||||||||||
| Subcellular localization wolf |
|
|||||||||||||||||||||||||||||||||||||||||||||
| Subcellular localization TargetP |
|
|||||||||||||||||||||||||||||||||||||||||||||
| Gene coexpression | ||||||||||||||||||||||||||||||||||||||||||||||
| Network*for coexpressed genes |
|
|||||||||||||||||||||||||||||||||||||||||||||
|---|---|---|---|---|---|---|---|---|---|---|---|---|---|---|---|---|---|---|---|---|---|---|---|---|---|---|---|---|---|---|---|---|---|---|---|---|---|---|---|---|---|---|---|---|---|---|
| Coexpressed gene list |
[Coexpressed gene list for AT5G23250] | |||||||||||||||||||||||||||||||||||||||||||||
| Gene expression | ||||||||||||||||||||||||||||||||||||||||||||||
| All samples | [Expression pattern for all samples] | |||||||||||||||||||||||||||||||||||||||||||||
| AtGenExpress* (Development) |
249828_at
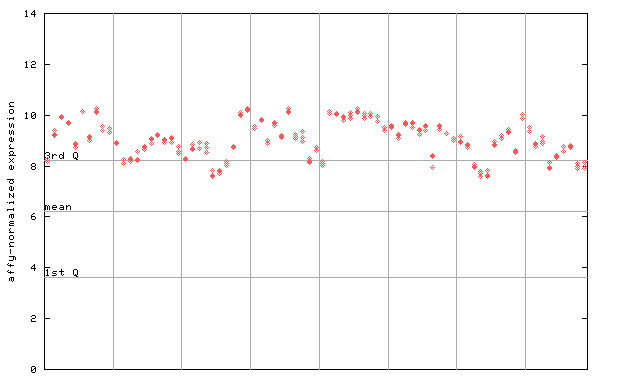
X axis is samples (pdf file), and Y axis is log2-expression. |
|||||||||||||||||||||||||||||||||||||||||||||
| AtGenExpress* (Stress) |
249828_at
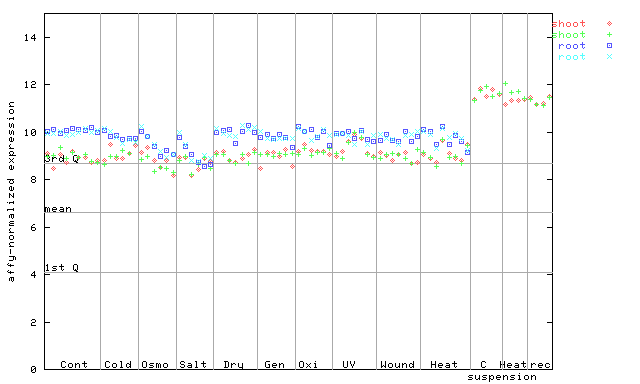
X axis is samples (pdf file), and Y axis is log2-expression. |
|||||||||||||||||||||||||||||||||||||||||||||
| AtGenExpress* (Hormone) |
249828_at
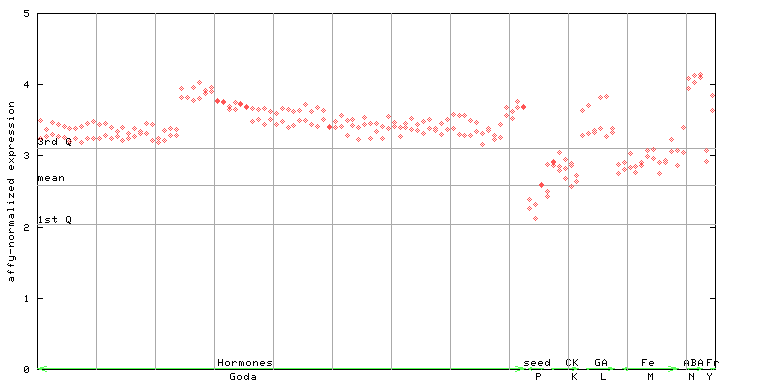
X axis is samples (xls file), and Y axis is log-expression. |
|||||||||||||||||||||||||||||||||||||||||||||


")
")
")
")
| Link to other DBs | ||
| Entrez Gene ID | 832389 |
|
| Refseq ID (protein) | NP_001119263.1 | |
| NP_001331781.1 | |
|
| NP_197716.1 | |
|
The preparation time of this page was 0.1 [sec].