[←][→] ath
| functional annotation | ||||||||||||||||||||||||||||||||||||||||||||
| Function | ribosomal protein S1 |


|
||||||||||||||||||||||||||||||||||||||||||
| GO BP |
|
|||||||||||||||||||||||||||||||||||||||||||
| GO CC |
|
|||||||||||||||||||||||||||||||||||||||||||
| GO MF |
|
|||||||||||||||||||||||||||||||||||||||||||
| KEGG | ath03010 [list] [network] Ribosome (356 genes) |  |
||||||||||||||||||||||||||||||||||||||||||
| Protein | NP_850903.1 | |||||||||||||||||||||||||||||||||||||||||||
| BLAST | NP_850903.1 | |||||||||||||||||||||||||||||||||||||||||||
| Orthologous | [Ortholog page] LOC4332652 (osa) LOC7485852 (ppo) LOC7498235 (ppo) LOC11410196 (mtr) LOC100265325 (vvi) LOC100283777 (zma) LOC100806905 (gma) LOC100810511 (gma) LOC100812847 (gma) LOC101245144 (sly) LOC101247851 (sly) LOC103837311 (bra) LOC103874603 (bra) | |||||||||||||||||||||||||||||||||||||||||||
| Subcellular localization wolf |
|
|||||||||||||||||||||||||||||||||||||||||||
| Subcellular localization TargetP |
|
|||||||||||||||||||||||||||||||||||||||||||
| Gene coexpression | ||||||||||||||||||||||||||||||||||||||||||||
| Network*for coexpressed genes |
|
|||||||||||||||||||||||||||||||||||||||||||
|---|---|---|---|---|---|---|---|---|---|---|---|---|---|---|---|---|---|---|---|---|---|---|---|---|---|---|---|---|---|---|---|---|---|---|---|---|---|---|---|---|---|---|---|---|
| Coexpressed gene list |
[Coexpressed gene list for RPS1] | |||||||||||||||||||||||||||||||||||||||||||
| Gene expression | ||||||||||||||||||||||||||||||||||||||||||||
| All samples | [Expression pattern for all samples] | |||||||||||||||||||||||||||||||||||||||||||
| AtGenExpress* (Development) |
246673_at
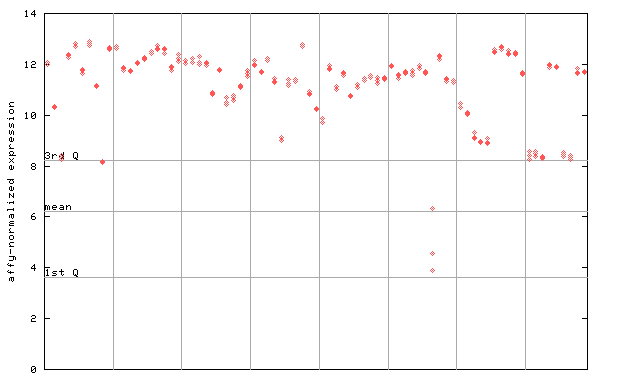
X axis is samples (pdf file), and Y axis is log2-expression. |
|||||||||||||||||||||||||||||||||||||||||||
| AtGenExpress* (Stress) |
246673_at
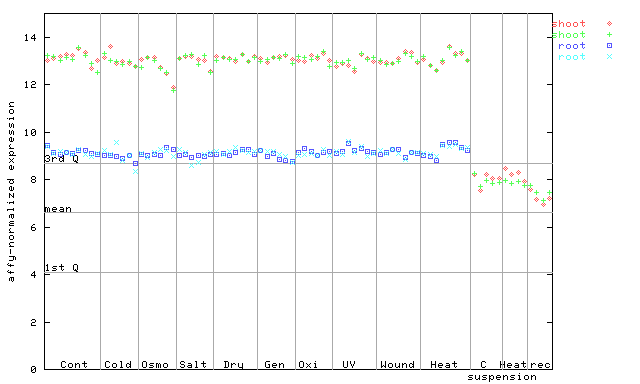
X axis is samples (pdf file), and Y axis is log2-expression. |
|||||||||||||||||||||||||||||||||||||||||||
| AtGenExpress* (Hormone) |
246673_at
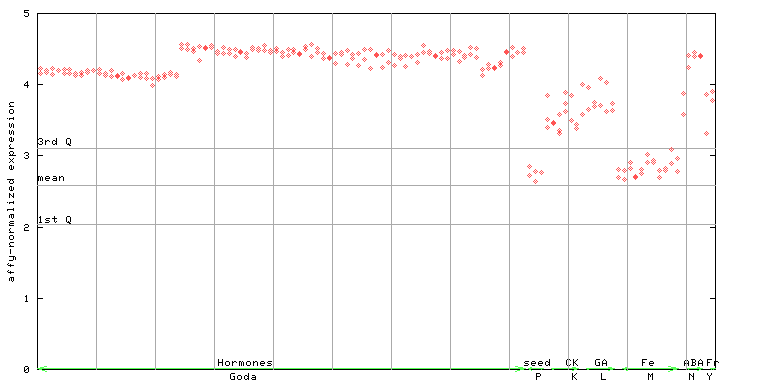
X axis is samples (xls file), and Y axis is log-expression. |
|||||||||||||||||||||||||||||||||||||||||||


")
| Link to other DBs | ||
| Entrez Gene ID | 833138 |
|
| Refseq ID (protein) | NP_850903.1 | |
The preparation time of this page was 0.2 [sec].