[←][→] ath
| functional annotation | |||||||||||||||||||||||||||||||
| Function | Folylpolyglutamate synthetase family protein |


|
|||||||||||||||||||||||||||||
| GO BP |
|
||||||||||||||||||||||||||||||
| GO CC |
|
||||||||||||||||||||||||||||||
| GO MF |
|
||||||||||||||||||||||||||||||
| KEGG | ath00790 [list] [network] Folate biosynthesis (26 genes) |  |
|||||||||||||||||||||||||||||
| Protein | NP_198963.2 | ||||||||||||||||||||||||||||||
| BLAST | NP_198963.2 | ||||||||||||||||||||||||||||||
| Orthologous | [Ortholog page] LOC9266309 (osa) LOC25482370 (mtr) LOC100267405 (vvi) LOC100285263 (zma) LOC100816933 (gma) LOC101257178 (sly) LOC103650558 (zma) LOC103827738 (bra) | ||||||||||||||||||||||||||||||
| Subcellular localization wolf |
|
||||||||||||||||||||||||||||||
| Subcellular localization TargetP |
|
||||||||||||||||||||||||||||||
| Gene coexpression | |||||||||||||||||||||||||||||||
| Network*for coexpressed genes |
|
||||||||||||||||||||||||||||||
|---|---|---|---|---|---|---|---|---|---|---|---|---|---|---|---|---|---|---|---|---|---|---|---|---|---|---|---|---|---|---|---|
| Coexpressed gene list |
[Coexpressed gene list for GLA1] | ||||||||||||||||||||||||||||||
| Gene expression | |||||||||||||||||||||||||||||||
| All samples | [Expression pattern for all samples] | ||||||||||||||||||||||||||||||
| AtGenExpress* (Development) |
249304_at
X axis is samples (pdf file), and Y axis is log2-expression. |
||||||||||||||||||||||||||||||
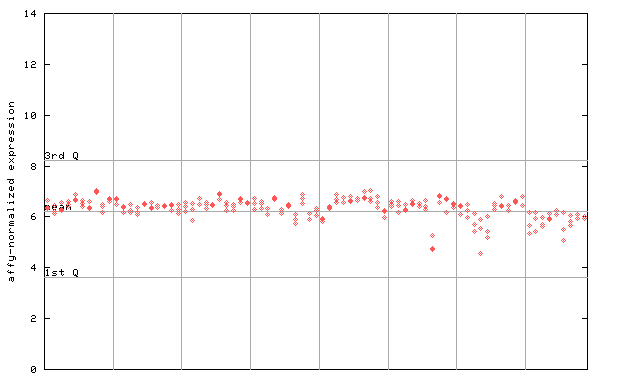
| AtGenExpress* (Stress) |
249304_at
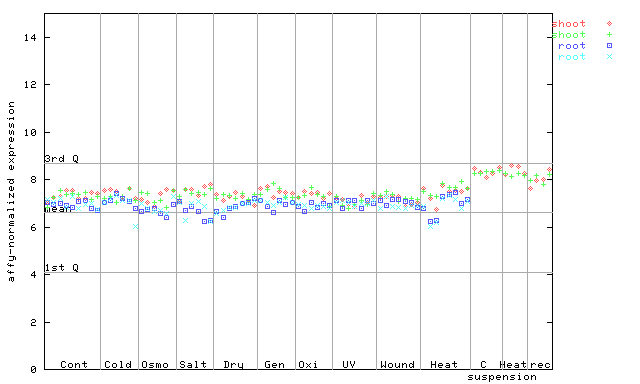
X axis is samples (pdf file), and Y axis is log2-expression. |
||||||||||||||||||||||||||||||
| AtGenExpress* (Hormone) |
249304_at
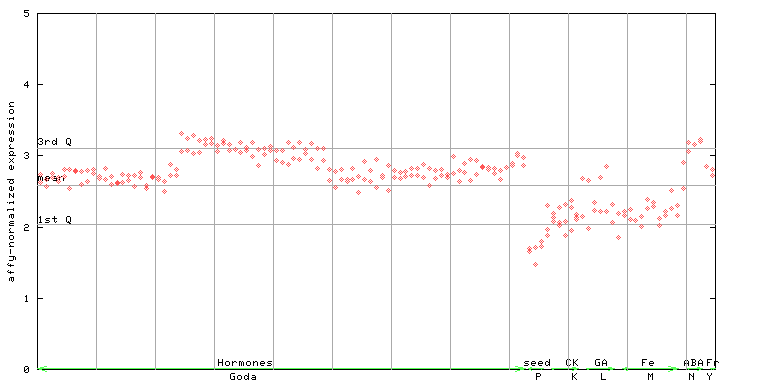
X axis is samples (xls file), and Y axis is log-expression. |
||||||||||||||||||||||||||||||


| Link to other DBs | ||
| Entrez Gene ID | 834149 |
|
| Refseq ID (protein) | NP_198963.2 | |
The preparation time of this page was 0.2 [sec].