[←][→] ath
| functional annotation | ||||||||||||||||||||||||||||||||||
| Function | electron transfer flavoprotein beta |


|
||||||||||||||||||||||||||||||||
| GO BP |
|
|||||||||||||||||||||||||||||||||
| GO CC |
|
|||||||||||||||||||||||||||||||||
| GO MF |
|
|||||||||||||||||||||||||||||||||
| KEGG | ||||||||||||||||||||||||||||||||||
| Protein | NP_001032002.1 NP_001078699.1 NP_001332757.1 NP_199156.1 | |||||||||||||||||||||||||||||||||
| BLAST | NP_001032002.1 NP_001078699.1 NP_001332757.1 NP_199156.1 | |||||||||||||||||||||||||||||||||
| Orthologous | [Ortholog page] LOC4335102 (osa) LOC18101599 (ppo) LOC25484422 (mtr) LOC100790069 (gma) LOC100806085 (gma) LOC101248614 (sly) LOC103839236 (bra) LOC123129123 (tae) LOC123140027 (tae) LOC123146288 (tae) LOC123406326 (hvu) | |||||||||||||||||||||||||||||||||
| Subcellular localization wolf |
|
|||||||||||||||||||||||||||||||||
| Subcellular localization TargetP |
|
|||||||||||||||||||||||||||||||||
| Gene coexpression | ||||||||||||||||||||||||||||||||||
| Network*for coexpressed genes |
|
|||||||||||||||||||||||||||||||||
|---|---|---|---|---|---|---|---|---|---|---|---|---|---|---|---|---|---|---|---|---|---|---|---|---|---|---|---|---|---|---|---|---|---|---|
| Coexpressed gene list |
[Coexpressed gene list for ETFBETA] | |||||||||||||||||||||||||||||||||
| Gene expression | ||||||||||||||||||||||||||||||||||
| All samples | [Expression pattern for all samples] | |||||||||||||||||||||||||||||||||
| AtGenExpress* (Development) |
249158_at
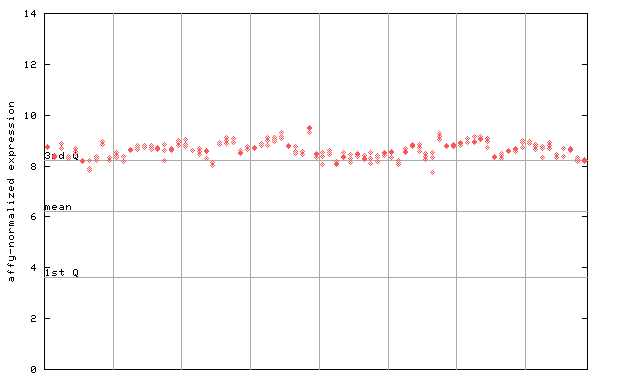
X axis is samples (pdf file), and Y axis is log2-expression. |
|||||||||||||||||||||||||||||||||
| AtGenExpress* (Stress) |
249158_at
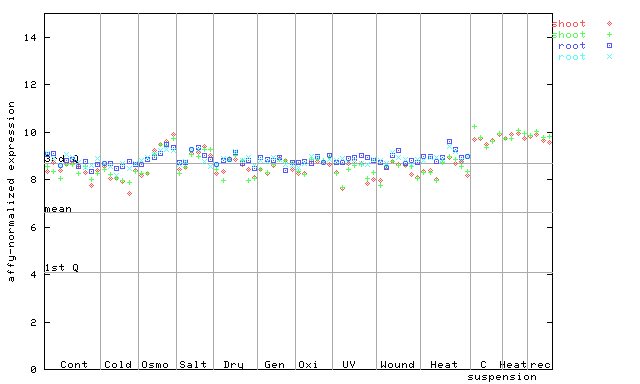
X axis is samples (pdf file), and Y axis is log2-expression. |
|||||||||||||||||||||||||||||||||
| AtGenExpress* (Hormone) |
249158_at
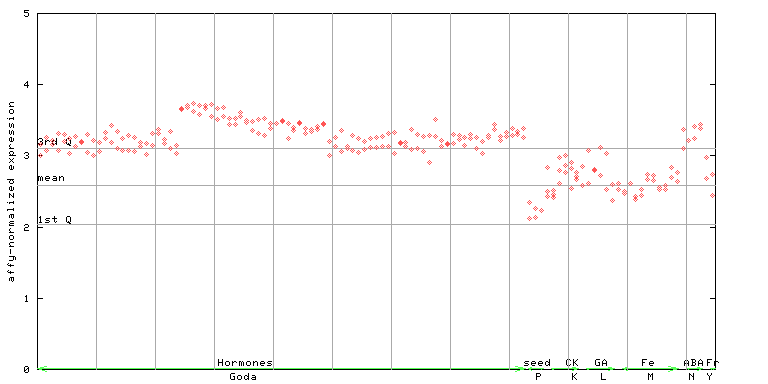
X axis is samples (xls file), and Y axis is log-expression. |
|||||||||||||||||||||||||||||||||


")
| Link to other DBs | ||
| Entrez Gene ID | 834363 |
|
| Refseq ID (protein) | NP_001032002.1 | |
| NP_001078699.1 | |
|
| NP_001332757.1 | |
|
| NP_199156.1 | |
|
The preparation time of this page was 0.2 [sec].