[←][→] ath
| functional annotation | ||||||||||||||||||||||||||||||||||||||
| Function | ureidoglycolate amidohydrolase |


|
||||||||||||||||||||||||||||||||||||
| GO BP |
|
|||||||||||||||||||||||||||||||||||||
| GO CC |
|
|||||||||||||||||||||||||||||||||||||
| GO MF |
|
|||||||||||||||||||||||||||||||||||||
| KEGG | ath00230 [list] [network] Purine metabolism (87 genes) |  |
||||||||||||||||||||||||||||||||||||
| Protein | NP_199173.2 | |||||||||||||||||||||||||||||||||||||
| BLAST | NP_199173.2 | |||||||||||||||||||||||||||||||||||||
| Orthologous | [Ortholog page] LOC4352706 (osa) LOC7498032 (ppo) LOC11425622 (mtr) LOC100797579 (gma) LOC100797997 (gma) LOC101246378 (sly) LOC103827965 (bra) LOC123119505 (tae) LOC123396027 (hvu) | |||||||||||||||||||||||||||||||||||||
| Subcellular localization wolf |
|
|||||||||||||||||||||||||||||||||||||
| Subcellular localization TargetP |
|
|||||||||||||||||||||||||||||||||||||
| Gene coexpression | ||||||||||||||||||||||||||||||||||||||
| Network*for coexpressed genes |
|
|||||||||||||||||||||||||||||||||||||
|---|---|---|---|---|---|---|---|---|---|---|---|---|---|---|---|---|---|---|---|---|---|---|---|---|---|---|---|---|---|---|---|---|---|---|---|---|---|---|
| Coexpressed gene list |
[Coexpressed gene list for UAH] | |||||||||||||||||||||||||||||||||||||
| Gene expression | ||||||||||||||||||||||||||||||||||||||
| All samples | [Expression pattern for all samples] | |||||||||||||||||||||||||||||||||||||
| AtGenExpress* (Development) |
249103_at
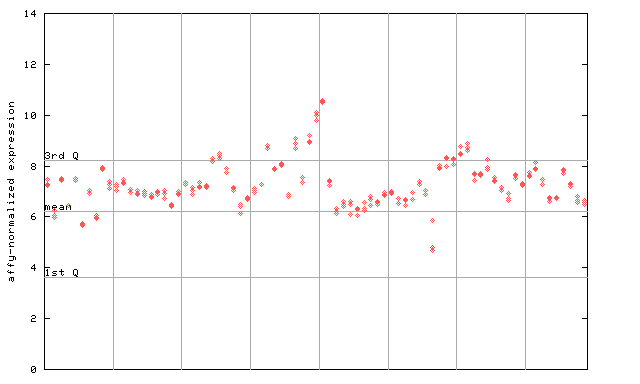
X axis is samples (pdf file), and Y axis is log2-expression. |
|||||||||||||||||||||||||||||||||||||
| AtGenExpress* (Stress) |
249103_at
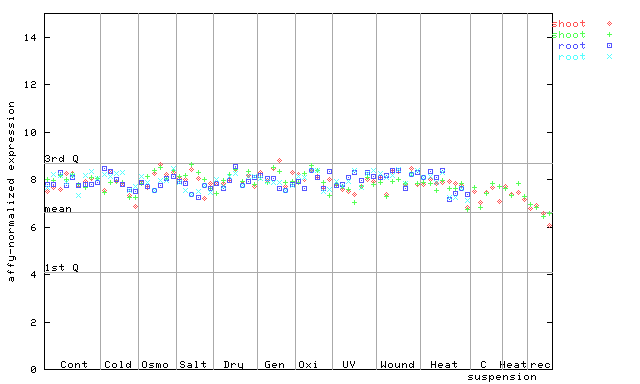
X axis is samples (pdf file), and Y axis is log2-expression. |
|||||||||||||||||||||||||||||||||||||
| AtGenExpress* (Hormone) |
249103_at
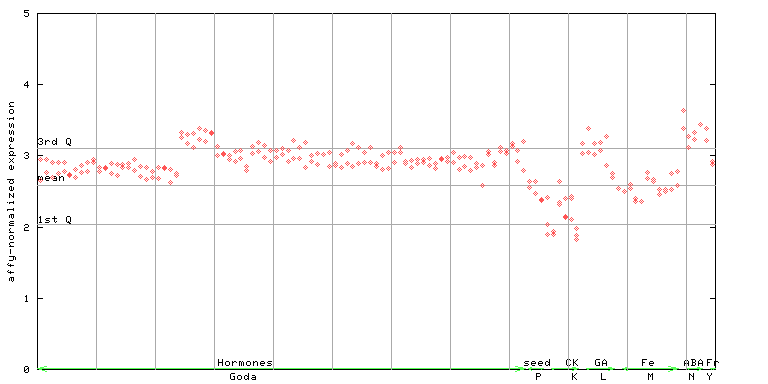
X axis is samples (xls file), and Y axis is log-expression. |
|||||||||||||||||||||||||||||||||||||


")
")
| Link to other DBs | ||
| Entrez Gene ID | 834380 |
|
| Refseq ID (protein) | NP_199173.2 | |
The preparation time of this page was 0.2 [sec].