[←][→] ath
| functional annotation | ||||||||||||||||||||||||||||||||||||||||||
| Function | Small nuclear ribonucleoprotein family protein |


|
||||||||||||||||||||||||||||||||||||||||
| GO BP |
|
|||||||||||||||||||||||||||||||||||||||||
| GO CC |
|
|||||||||||||||||||||||||||||||||||||||||
| GO MF |
|
|||||||||||||||||||||||||||||||||||||||||
| KEGG | ath03040 [list] [network] Spliceosome (203 genes) |  |
||||||||||||||||||||||||||||||||||||||||
| Protein | NP_001032011.1 NP_199263.1 | |||||||||||||||||||||||||||||||||||||||||
| BLAST | NP_001032011.1 NP_199263.1 | |||||||||||||||||||||||||||||||||||||||||
| Orthologous | [Ortholog page] smB (ath) LOC9270807 (osa) LOC11431976 (mtr) LOC18095770 (ppo) LOC25501710 (mtr) LOC100780500 (gma) LOC100786807 (gma) LOC101262959 (sly) LOC103834168 (bra) LOC103858296 (bra) LOC123045027 (tae) LOC123052809 (tae) LOC123188677 (tae) LOC123426167 (hvu) | |||||||||||||||||||||||||||||||||||||||||
| Subcellular localization wolf |
|
|||||||||||||||||||||||||||||||||||||||||
| Subcellular localization TargetP |
|
|||||||||||||||||||||||||||||||||||||||||
| Gene coexpression | ||||||||||||||||||||||||||||||||||||||||||
| Network*for coexpressed genes |
|
|||||||||||||||||||||||||||||||||||||||||
|---|---|---|---|---|---|---|---|---|---|---|---|---|---|---|---|---|---|---|---|---|---|---|---|---|---|---|---|---|---|---|---|---|---|---|---|---|---|---|---|---|---|---|
| Coexpressed gene list |
[Coexpressed gene list for AT5G44500] | |||||||||||||||||||||||||||||||||||||||||
| Gene expression | ||||||||||||||||||||||||||||||||||||||||||
| All samples | [Expression pattern for all samples] | |||||||||||||||||||||||||||||||||||||||||
| AtGenExpress* (Development) |
249003_at
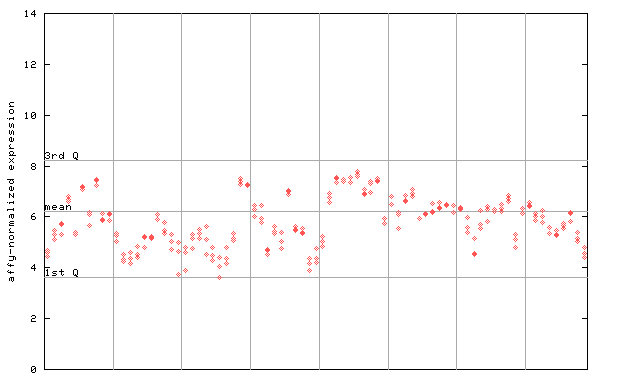
X axis is samples (pdf file), and Y axis is log2-expression. |
|||||||||||||||||||||||||||||||||||||||||
| AtGenExpress* (Stress) |
249003_at
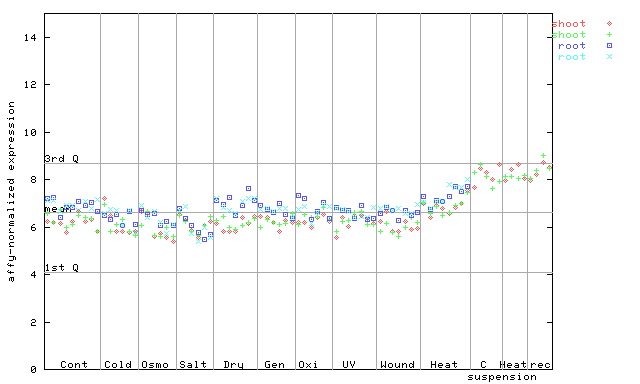
X axis is samples (pdf file), and Y axis is log2-expression. |
|||||||||||||||||||||||||||||||||||||||||
| AtGenExpress* (Hormone) |
249003_at
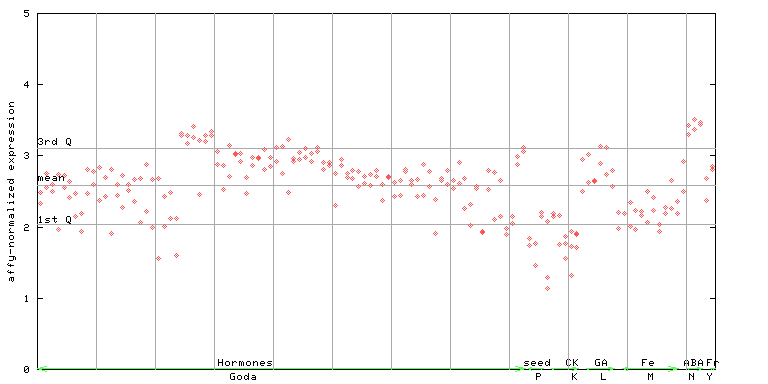
X axis is samples (xls file), and Y axis is log-expression. |
|||||||||||||||||||||||||||||||||||||||||


")
")
")
| Link to other DBs | ||
| Entrez Gene ID | 834477 |
|
| Refseq ID (protein) | NP_001032011.1 | |
| NP_199263.1 | |
|
The preparation time of this page was 0.1 [sec].