[←][→] ath
| functional annotation | ||||||||||||||||||||||||||||||||||
| Function | 37S ribosomal protein S27 |


|
||||||||||||||||||||||||||||||||
| GO BP |
|
|||||||||||||||||||||||||||||||||
| GO CC |
|
|||||||||||||||||||||||||||||||||
| GO MF |
|
|||||||||||||||||||||||||||||||||
| KEGG | ||||||||||||||||||||||||||||||||||
| Protein | NP_199284.2 | |||||||||||||||||||||||||||||||||
| BLAST | NP_199284.2 | |||||||||||||||||||||||||||||||||
| Orthologous | [Ortholog page] LOC4337808 (osa) LOC7465365 (ppo) LOC25500910 (mtr) LOC100788607 (gma) LOC100801934 (gma) LOC101248990 (sly) LOC101253100 (sly) LOC103827838 (bra) LOC103839169 (bra) LOC103848463 (bra) LOC123038552 (tae) LOC123088145 (tae) LOC123180461 (tae) LOC123425015 (hvu) | |||||||||||||||||||||||||||||||||
| Subcellular localization wolf |
|
|||||||||||||||||||||||||||||||||
| Subcellular localization TargetP |
|
|||||||||||||||||||||||||||||||||
| Gene coexpression | ||||||||||||||||||||||||||||||||||
| Network*for coexpressed genes |
|
|||||||||||||||||||||||||||||||||
|---|---|---|---|---|---|---|---|---|---|---|---|---|---|---|---|---|---|---|---|---|---|---|---|---|---|---|---|---|---|---|---|---|---|---|
| Coexpressed gene list |
[Coexpressed gene list for AT5G44710] | |||||||||||||||||||||||||||||||||
| Gene expression | ||||||||||||||||||||||||||||||||||
| All samples | [Expression pattern for all samples] | |||||||||||||||||||||||||||||||||
| AtGenExpress* (Development) |
249014_at
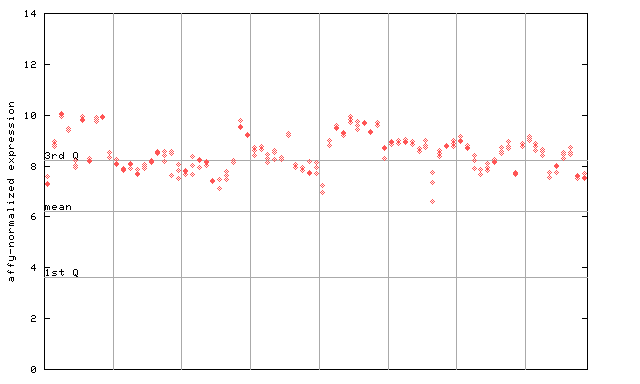
X axis is samples (pdf file), and Y axis is log2-expression. |
|||||||||||||||||||||||||||||||||
| AtGenExpress* (Stress) |
249014_at
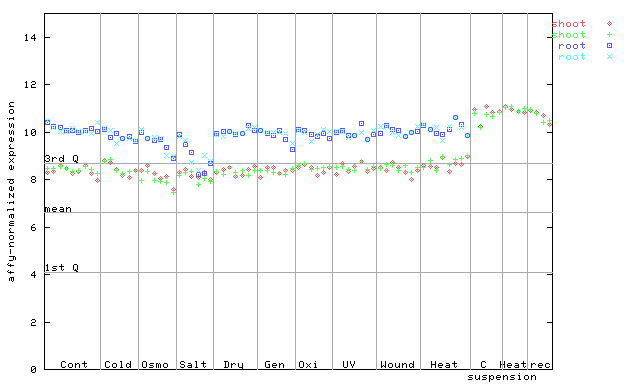
X axis is samples (pdf file), and Y axis is log2-expression. |
|||||||||||||||||||||||||||||||||
| AtGenExpress* (Hormone) |
249014_at
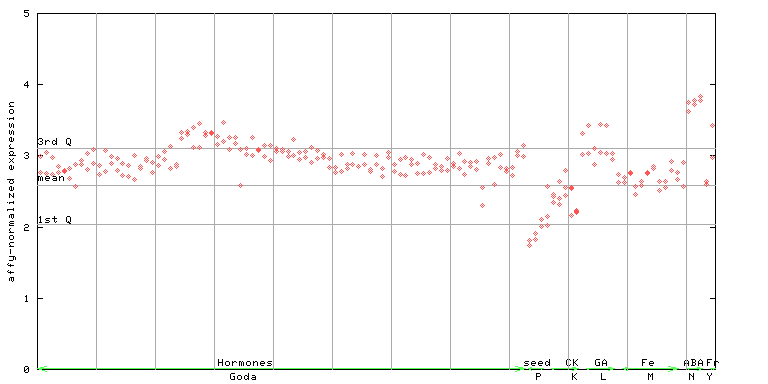
X axis is samples (xls file), and Y axis is log-expression. |
|||||||||||||||||||||||||||||||||


")
| Link to other DBs | ||
| Entrez Gene ID | 834500 |
|
| Refseq ID (protein) | NP_199284.2 | |
The preparation time of this page was 0.1 [sec].