[←][→] ath
| functional annotation | |||||||||||||||||||||||||||||||
| Function | Peroxidase superfamily protein |


|
|||||||||||||||||||||||||||||
| GO BP |
|
||||||||||||||||||||||||||||||
| GO CC |
|
||||||||||||||||||||||||||||||
| GO MF |
|
||||||||||||||||||||||||||||||
| KEGG | ath00940 [list] [network] Phenylpropanoid biosynthesis (166 genes) |  |
|||||||||||||||||||||||||||||
| Protein | NP_200002.3 | ||||||||||||||||||||||||||||||
| BLAST | NP_200002.3 | ||||||||||||||||||||||||||||||
| Orthologous | [Ortholog page] LOC11413151 (mtr) LOC100254001 (vvi) LOC100258717 (vvi) LOC100795422 (gma) LOC100799516 (gma) LOC101266098 (sly) LOC103832692 (bra) LOC103852125 (bra) | ||||||||||||||||||||||||||||||
| Subcellular localization wolf |
|
||||||||||||||||||||||||||||||
| Subcellular localization TargetP |
|
||||||||||||||||||||||||||||||
| Gene coexpression | |||||||||||||||||||||||||||||||
| Network*for coexpressed genes |
|
||||||||||||||||||||||||||||||
|---|---|---|---|---|---|---|---|---|---|---|---|---|---|---|---|---|---|---|---|---|---|---|---|---|---|---|---|---|---|---|---|
| Coexpressed gene list |
[Coexpressed gene list for AT5G51890] | ||||||||||||||||||||||||||||||
| Gene expression | |||||||||||||||||||||||||||||||
| All samples | [Expression pattern for all samples] | ||||||||||||||||||||||||||||||
| AtGenExpress* (Development) |
248382_at
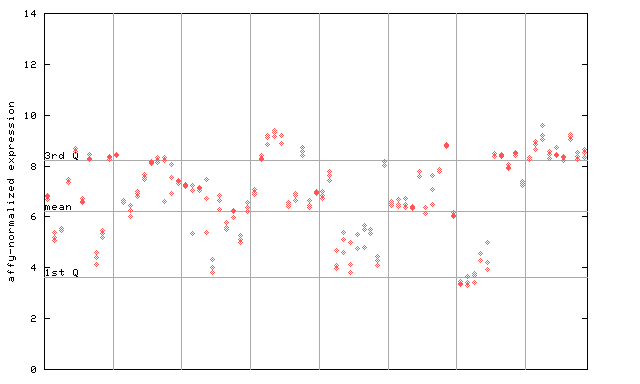
X axis is samples (pdf file), and Y axis is log2-expression. |
||||||||||||||||||||||||||||||
| AtGenExpress* (Stress) |
248382_at
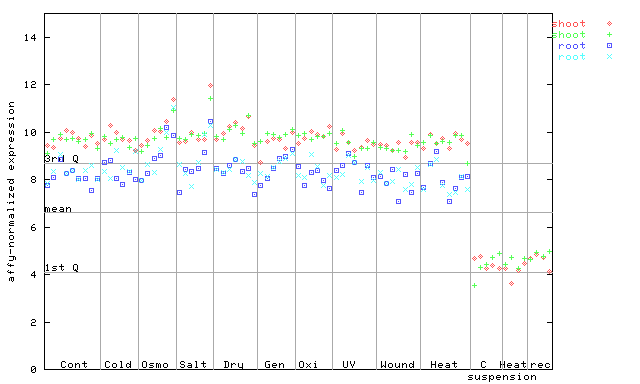
X axis is samples (pdf file), and Y axis is log2-expression. |
||||||||||||||||||||||||||||||
| AtGenExpress* (Hormone) |
248382_at
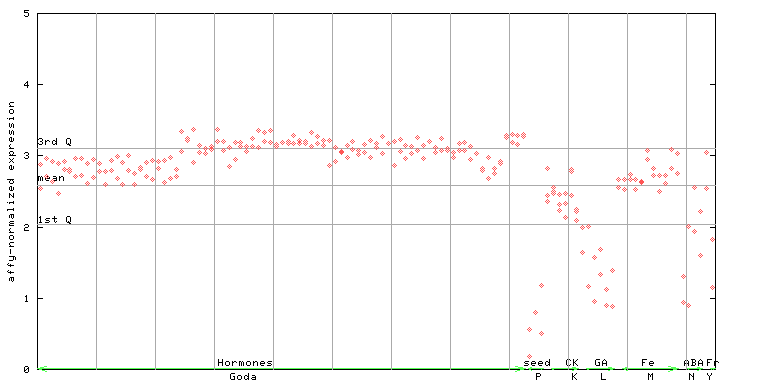
X axis is samples (xls file), and Y axis is log-expression. |
||||||||||||||||||||||||||||||


| Link to other DBs | ||
| Entrez Gene ID | 835264 |
|
| Refseq ID (protein) | NP_200002.3 | |
The preparation time of this page was 0.2 [sec].