[←][→] ath
| functional annotation | |||||||||||||||||||||||||||||||
| Function | cytochrome c biogenesis protein family |


|
|||||||||||||||||||||||||||||
| GO BP |
|
||||||||||||||||||||||||||||||
| GO CC |
|
||||||||||||||||||||||||||||||
| GO MF |
|
||||||||||||||||||||||||||||||
| KEGG | |||||||||||||||||||||||||||||||
| Protein | NP_001190537.1 NP_200240.1 | ||||||||||||||||||||||||||||||
| BLAST | NP_001190537.1 NP_200240.1 | ||||||||||||||||||||||||||||||
| Orthologous | [Ortholog page] LOC4349738 (osa) LOC9266150 (osa) LOC18095650 (ppo) LOC25502555 (mtr) CCDA (gma) LOC100815609 (gma) LOC101268704 (sly) LOC103851974 (bra) LOC123111240 (tae) LOC123120332 (tae) LOC123396984 (hvu) | ||||||||||||||||||||||||||||||
| Subcellular localization wolf |
|
||||||||||||||||||||||||||||||
| Subcellular localization TargetP |
|
||||||||||||||||||||||||||||||
| Gene coexpression | |||||||||||||||||||||||||||||||
| Network*for coexpressed genes |
|
||||||||||||||||||||||||||||||
|---|---|---|---|---|---|---|---|---|---|---|---|---|---|---|---|---|---|---|---|---|---|---|---|---|---|---|---|---|---|---|---|
| Coexpressed gene list |
[Coexpressed gene list for CcdA] | ||||||||||||||||||||||||||||||
| Gene expression | |||||||||||||||||||||||||||||||
| All samples | [Expression pattern for all samples] | ||||||||||||||||||||||||||||||
| AtGenExpress* (Development) |
248181_at
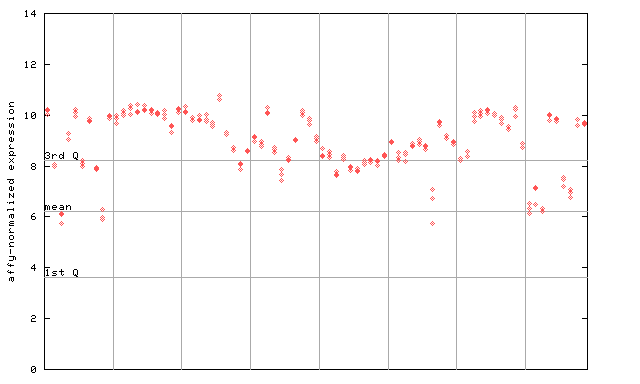
X axis is samples (pdf file), and Y axis is log2-expression. |
||||||||||||||||||||||||||||||
| AtGenExpress* (Stress) |
248181_at

X axis is samples (pdf file), and Y axis is log2-expression. |
||||||||||||||||||||||||||||||
| AtGenExpress* (Hormone) |
248181_at

X axis is samples (xls file), and Y axis is log-expression. |
||||||||||||||||||||||||||||||


| Link to other DBs | ||
| Entrez Gene ID | 835517 |
|
| Refseq ID (protein) | NP_001190537.1 | |
| NP_200240.1 | |
|
The preparation time of this page was 0.1 [sec].