| functional annotation |
| Function |
O-Glycosyl hydrolases family 17 protein |


|
| GO BP |
|
GO:1901657 [list] [network] glycosyl compound metabolic process
|
(65 genes)
|
IEA
|
 |
|
GO:0000910 [list] [network] cytokinesis
|
(150 genes)
|
IEA
|
|
|
GO:0006631 [list] [network] fatty acid metabolic process
|
(214 genes)
|
IEA
|
|
|
GO:1903046 [list] [network] meiotic cell cycle process
|
(255 genes)
|
IEA
|
|
|
GO:0009753 [list] [network] response to jasmonic acid
|
(611 genes)
|
IEA
|
|
|
GO:0019748 [list] [network] secondary metabolic process
|
(766 genes)
|
IEA
|
|
|
GO:0009611 [list] [network] response to wounding
|
(816 genes)
|
IEA
|
|
|
GO:0005975 [list] [network] carbohydrate metabolic process
|
(844 genes)
|
IEA
|
|
|
GO:0006970 [list] [network] response to osmotic stress
|
(883 genes)
|
IEA
|
|
|
GO:0009414 [list] [network] response to water deprivation
|
(1006 genes)
|
IEA
|
|
|
GO:0009737 [list] [network] response to abscisic acid
|
(1086 genes)
|
IEA
|
|
|
GO:0019752 [list] [network] carboxylic acid metabolic process
|
(1307 genes)
|
IEA
|
|
|
| GO CC |
|
GO:0005576 [list] [network] extracellular region
|
(3154 genes)
|
ISM
|
|
|
GO:0009507 [list] [network] chloroplast
|
(5004 genes)
|
ISM
|
|
|
| GO MF |
|
GO:0042973 [list] [network] glucan endo-1,3-beta-D-glucosidase activity
|
(51 genes)
|
IEA
|
|
|
| KEGG |
|
|
| Protein |
NP_001154780.1
NP_568822.1
|
| BLAST |
NP_001154780.1
NP_568822.1
|
| Orthologous |
[Ortholog page]
AT2G05790 (ath)
AT4G26830 (ath)
LOC4330874 (osa)
LOC7455176 (ppo)
LOC7458288 (ppo)
LOC7483651 (ppo)
LOC11421306 (mtr)
LOC11443025 (mtr)
LOC25483677 (mtr)
LOC100797861 (gma)
LOC100800383 (gma)
LOC100803406 (gma)
LOC100819716 (gma)
LOC101265618 (sly)
LOC101268410 (sly)
LOC103828512 (bra)
LOC103844962 (bra)
LOC103851896 (bra)
LOC103857002 (bra)
LOC103861658 (bra)
LOC123128526 (tae)
LOC123138393 (tae)
LOC123145646 (tae)
LOC123401679 (hvu)
|
Subcellular
localization
wolf |
|
chlo 5,
extr 1,
E.R. 1,
nucl 1,
mito 1,
vacu 1,
E.R._plas 1,
cyto_E.R. 1
|
(predict for NP_001154780.1)
|
|
chlo 4,
extr 1,
vacu 1,
E.R. 1,
E.R._vacu 1
|
(predict for NP_568822.1)
|
|
Subcellular
localization
TargetP |
|
scret 8
|
(predict for NP_001154780.1)
|
|
scret 8
|
(predict for NP_568822.1)
|
|
| Gene coexpression |
Network*for
coexpressed
genes |
| KEGG* ID |
Title |
#genes |
Link to the KEGG* map
(Multiple genes) |
| ath00460 |
Cyanoamino acid metabolism |
2 |
") |
| ath00500 |
Starch and sucrose metabolism |
2 |
") |
| ath00999 |
Biosynthesis of various plant secondary metabolites; Including: Crocin biosynthesis, Cannabidiol biosynthesis, Mugineic acid biosynthesis, Pentagalloylglucose biosynthesis, Benzoxazinoid biosynthesis, Gramine biosynthesis, Coumarin biosynthesis, Furanocoumarin biosynthesis, Hordatine biosynthesis, Podophyllotoxin biosynthesis |
2 |
") |
Genes directly connected with AT5G55180 on the network
| coex z* |
Locus |
Function* |
CoexViewer |
Entrez Gene ID* |
| 7.1 |
AT3G07320 |
O-Glycosyl hydrolases family 17 protein |
[detail] |
819920 |
| 5.4 |
AT5G15510 |
TPX2 (targeting protein for Xklp2) protein family |
[detail] |
831404 |
| 5.2 |
AT4G35730 |
Regulator of Vps4 activity in the MVB pathway protein |
[detail] |
829726 |
| 4.6 |
BGLU15 |
beta glucosidase 15 |
[detail] |
819052 |
| 4.2 |
AT5G14230 |
ankyrin |
[detail] |
831273 |
|
Coexpressed
gene list |
[Coexpressed gene list for AT5G55180]
|
| Gene expression |
| All samples |
[Expression pattern for all samples]
|
AtGenExpress*
(Development) |
248100_at
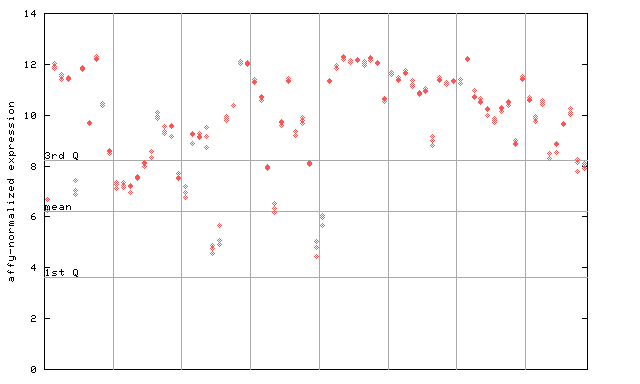
X axis is samples (pdf file), and Y axis is log2-expression.
"1st Q", "mean" and "3rd Q" indecate the values for all genes on a GeneChip. Q: quartile.
|
AtGenExpress*
(Stress) |
248100_at
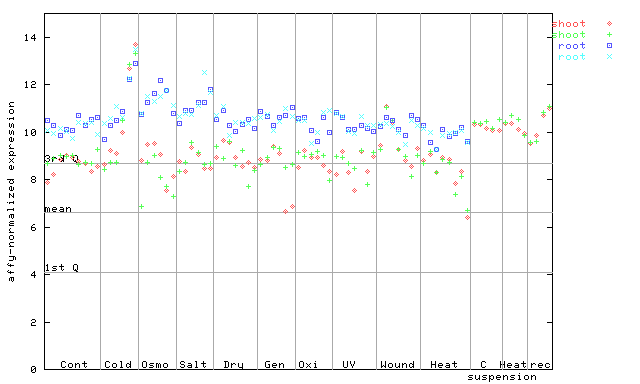
X axis is samples (pdf file), and Y axis is log2-expression.
|
AtGenExpress*
(Hormone) |
248100_at
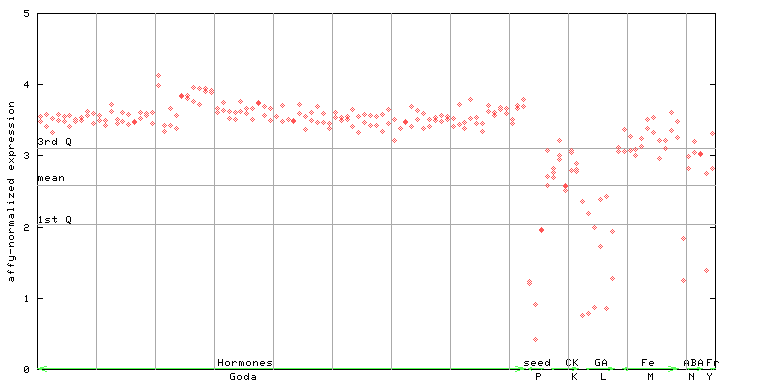
X axis is samples (xls file), and Y axis is log-expression.
|
