[←][→] ath
| functional annotation | |||||||||||||||||||||||||||||||||||||||||||||||||||||||
| Function | isopentenyl-diphosphate delta-isomerase |


|
|||||||||||||||||||||||||||||||||||||||||||||||||||||
| GO BP |
|
||||||||||||||||||||||||||||||||||||||||||||||||||||||
| GO CC |
|
||||||||||||||||||||||||||||||||||||||||||||||||||||||
| GO MF |
|
||||||||||||||||||||||||||||||||||||||||||||||||||||||
| KEGG | |||||||||||||||||||||||||||||||||||||||||||||||||||||||
| Protein | NP_200372.1 NP_974939.1 | ||||||||||||||||||||||||||||||||||||||||||||||||||||||
| BLAST | NP_200372.1 NP_974939.1 | ||||||||||||||||||||||||||||||||||||||||||||||||||||||
| Orthologous | [Ortholog page] LOC4352266 (osa) LOC7487535 (ppo) LOC11428426 (mtr) LOC11428478 (mtr) LOC11441423 (mtr) LOC100807129 (gma) LOC100808514 (gma) LOC101252170 (sly) LOC103845006 (bra) LOC103851870 (bra) LOC123102770 (tae) LOC123110989 (tae) LOC123119976 (tae) LOC123395644 (hvu) | ||||||||||||||||||||||||||||||||||||||||||||||||||||||
| Subcellular localization wolf |
|
||||||||||||||||||||||||||||||||||||||||||||||||||||||
| Subcellular localization TargetP |
|
||||||||||||||||||||||||||||||||||||||||||||||||||||||
| Gene coexpression | |||||||||||||||||||||||||||||||||||||||||||||||||||||||
| Network*for coexpressed genes |
|
||||||||||||||||||||||||||||||||||||||||||||||||||||||
|---|---|---|---|---|---|---|---|---|---|---|---|---|---|---|---|---|---|---|---|---|---|---|---|---|---|---|---|---|---|---|---|---|---|---|---|---|---|---|---|---|---|---|---|---|---|---|---|---|---|---|---|---|---|---|---|
| Coexpressed gene list |
[Coexpressed gene list for AT5G55610] | ||||||||||||||||||||||||||||||||||||||||||||||||||||||
| Gene expression | |||||||||||||||||||||||||||||||||||||||||||||||||||||||
| All samples | [Expression pattern for all samples] | ||||||||||||||||||||||||||||||||||||||||||||||||||||||
| AtGenExpress* (Development) |
248068_at
X axis is samples (pdf file), and Y axis is log2-expression. |
||||||||||||||||||||||||||||||||||||||||||||||||||||||
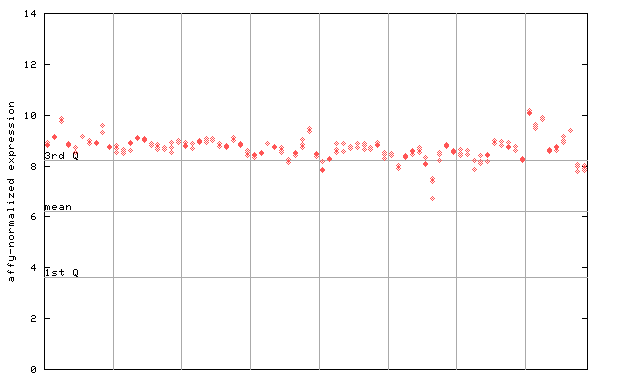
| AtGenExpress* (Stress) |
248068_at
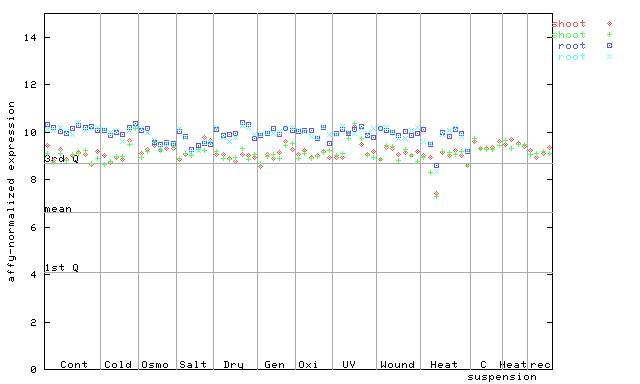
X axis is samples (pdf file), and Y axis is log2-expression. |
||||||||||||||||||||||||||||||||||||||||||||||||||||||
| AtGenExpress* (Hormone) |
248068_at
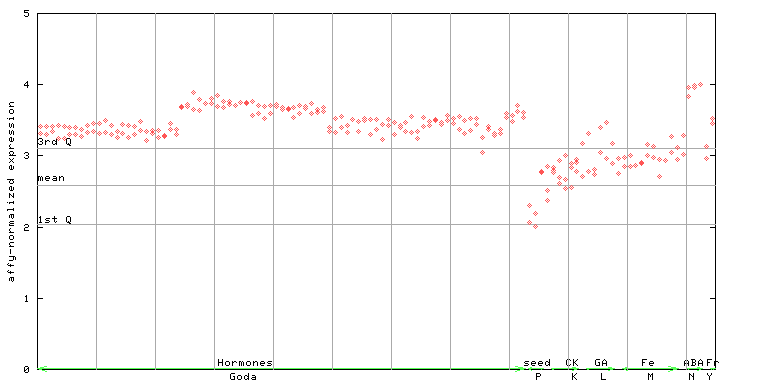
X axis is samples (xls file), and Y axis is log-expression. |
||||||||||||||||||||||||||||||||||||||||||||||||||||||


")
")
")
")
")
| Link to other DBs | ||
| Entrez Gene ID | 835655 |
|
| Refseq ID (protein) | NP_200372.1 | |
| NP_974939.1 | |
|
The preparation time of this page was 0.1 [sec].