[←][→] ath
| functional annotation | |||||||||||||||||||||||||||||||||||||||||||||||||||
| Function | uncharacterized protein |


|
|||||||||||||||||||||||||||||||||||||||||||||||||
| GO BP |
|
||||||||||||||||||||||||||||||||||||||||||||||||||
| GO CC |
|
||||||||||||||||||||||||||||||||||||||||||||||||||
| GO MF |
|
||||||||||||||||||||||||||||||||||||||||||||||||||
| KEGG | |||||||||||||||||||||||||||||||||||||||||||||||||||
| Protein | NP_001318823.1 NP_200618.3 | ||||||||||||||||||||||||||||||||||||||||||||||||||
| BLAST | NP_001318823.1 NP_200618.3 | ||||||||||||||||||||||||||||||||||||||||||||||||||
| Orthologous | [Ortholog page] LOC4329337 (osa) LOC7454903 (ppo) LOC11410975 (mtr) LOC18107893 (ppo) LOC100779643 (gma) LOC100800000 (gma) LOC101252412 (sly) LOC103845245 (bra) LOC123105716 (tae) LOC123114047 (tae) LOC123123539 (tae) LOC123453097 (hvu) | ||||||||||||||||||||||||||||||||||||||||||||||||||
| Subcellular localization wolf |
|
||||||||||||||||||||||||||||||||||||||||||||||||||
| Subcellular localization TargetP |
|
||||||||||||||||||||||||||||||||||||||||||||||||||
| Gene coexpression | |||||||||||||||||||||||||||||||||||||||||||||||||||
| Network*for coexpressed genes |
|
||||||||||||||||||||||||||||||||||||||||||||||||||
|---|---|---|---|---|---|---|---|---|---|---|---|---|---|---|---|---|---|---|---|---|---|---|---|---|---|---|---|---|---|---|---|---|---|---|---|---|---|---|---|---|---|---|---|---|---|---|---|---|---|---|---|
| Coexpressed gene list |
[Coexpressed gene list for AT5G58100] | ||||||||||||||||||||||||||||||||||||||||||||||||||
| Gene expression | |||||||||||||||||||||||||||||||||||||||||||||||||||
| All samples | [Expression pattern for all samples] | ||||||||||||||||||||||||||||||||||||||||||||||||||
| AtGenExpress* (Development) |
247846_at
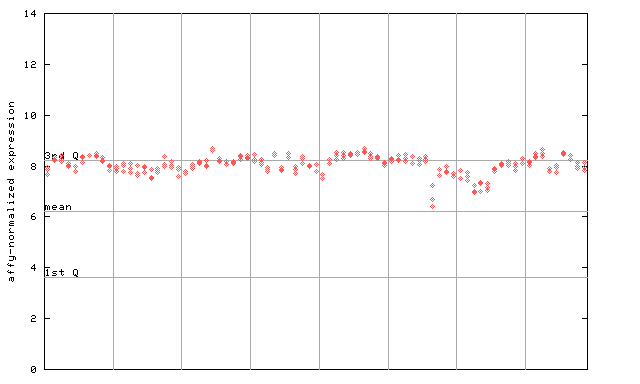
X axis is samples (pdf file), and Y axis is log2-expression. |
||||||||||||||||||||||||||||||||||||||||||||||||||
| AtGenExpress* (Stress) |
247846_at
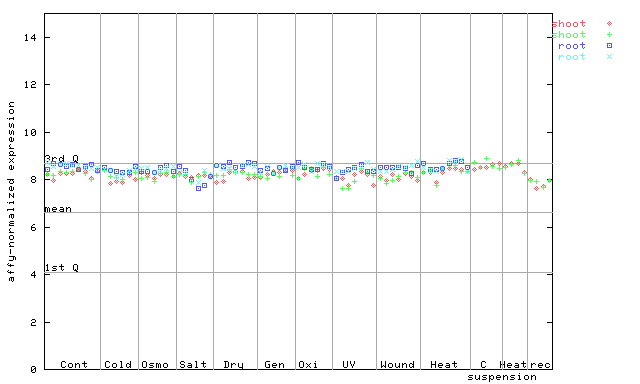
X axis is samples (pdf file), and Y axis is log2-expression. |
||||||||||||||||||||||||||||||||||||||||||||||||||
| AtGenExpress* (Hormone) |
247846_at
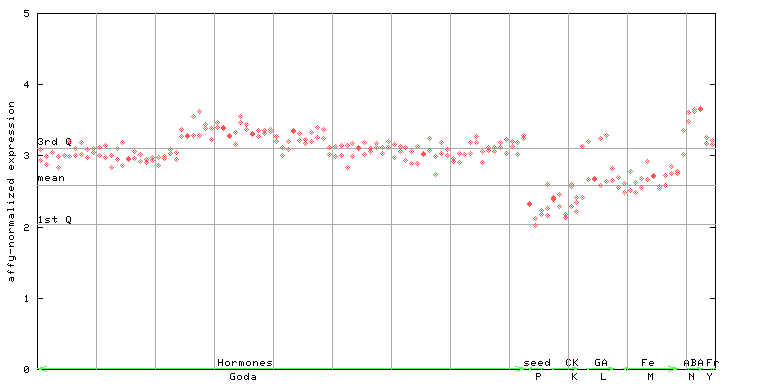
X axis is samples (xls file), and Y axis is log-expression. |
||||||||||||||||||||||||||||||||||||||||||||||||||


")
")
")
")
| Link to other DBs | ||
| Entrez Gene ID | 835922 |
|
| Refseq ID (protein) | NP_001318823.1 | |
| NP_200618.3 | |
|
The preparation time of this page was 0.1 [sec].