[←][→] ath
| functional annotation | ||||||||||||||||||||||||||||||||||
| Function | Protein-tyrosine phosphatase-like, PTPLA |


|
||||||||||||||||||||||||||||||||
| GO BP |
|
|||||||||||||||||||||||||||||||||
| GO CC |
|
|||||||||||||||||||||||||||||||||
| GO MF |
|
|||||||||||||||||||||||||||||||||
| KEGG | ath00062 [list] [network] Fatty acid elongation (36 genes) |  |
||||||||||||||||||||||||||||||||
| ath01040 [list] [network] Biosynthesis of unsaturated fatty acids (25 genes) | |
|||||||||||||||||||||||||||||||||
| ath01212 [list] [network] Fatty acid metabolism (70 genes) | |
|||||||||||||||||||||||||||||||||
| Protein | NP_001318841.1 | |||||||||||||||||||||||||||||||||
| BLAST | NP_001318841.1 | |||||||||||||||||||||||||||||||||
| Orthologous | [Ortholog page] LOC4339019 (osa) LOC7485725 (ppo) LOC11406472 (mtr) LOC100527607 (gma) LOC101262991 (sly) LOC103851552 (bra) LOC123059144 (tae) LOC123093603 (tae) LOC123136094 (tae) LOC123182270 (tae) LOC123445381 (hvu) | |||||||||||||||||||||||||||||||||
| Subcellular localization wolf |
|
|||||||||||||||||||||||||||||||||
| Subcellular localization TargetP |
|
|||||||||||||||||||||||||||||||||
| Gene coexpression | ||||||||||||||||||||||||||||||||||
| Network*for coexpressed genes |
|
|||||||||||||||||||||||||||||||||
|---|---|---|---|---|---|---|---|---|---|---|---|---|---|---|---|---|---|---|---|---|---|---|---|---|---|---|---|---|---|---|---|---|---|---|
| Coexpressed gene list |
[Coexpressed gene list for AT5G59770] | |||||||||||||||||||||||||||||||||
| Gene expression | ||||||||||||||||||||||||||||||||||
| All samples | [Expression pattern for all samples] | |||||||||||||||||||||||||||||||||
| AtGenExpress* (Development) |
247689_at
X axis is samples (pdf file), and Y axis is log2-expression. |
|||||||||||||||||||||||||||||||||
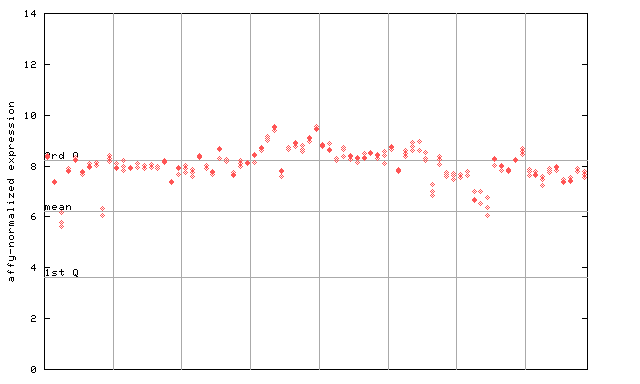
| AtGenExpress* (Stress) |
247689_at
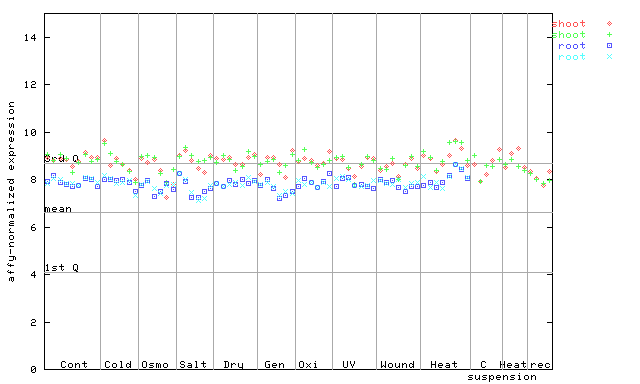
X axis is samples (pdf file), and Y axis is log2-expression. |
|||||||||||||||||||||||||||||||||
| AtGenExpress* (Hormone) |
247689_at
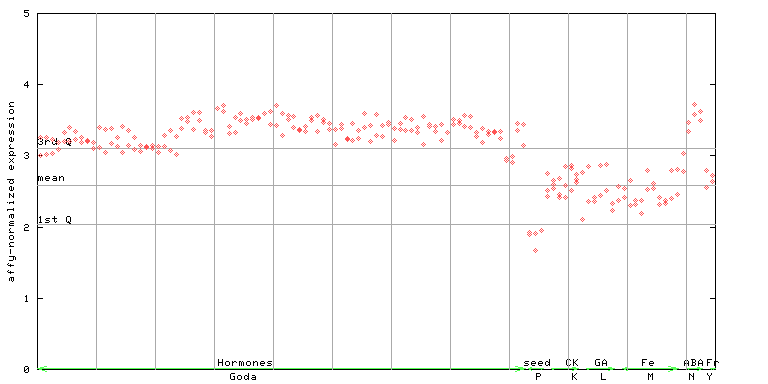
X axis is samples (xls file), and Y axis is log-expression. |
|||||||||||||||||||||||||||||||||

")
| Link to other DBs | ||
| Entrez Gene ID | 836098 |
|
| Refseq ID (protein) | NP_001318841.1 | |
The preparation time of this page was 0.1 [sec].