[←][→] ath
| functional annotation | ||||||||||||||||||||||||||
| Function | peptidemethionine sulfoxide reductase 1 |


|
||||||||||||||||||||||||
| GO BP |
|
|||||||||||||||||||||||||
| GO CC |
|
|||||||||||||||||||||||||
| GO MF |
|
|||||||||||||||||||||||||
| KEGG | ||||||||||||||||||||||||||
| Protein | NP_001331838.1 NP_568937.1 | |||||||||||||||||||||||||
| BLAST | NP_001331838.1 NP_568937.1 | |||||||||||||||||||||||||
| Orthologous | [Ortholog page] PMSR4 (ath) PMSR3 (ath) LOC4349402 (osa) LOC11433534 (mtr) LOC11441522 (mtr) LOC100258013 (vvi) LOC100285733 (zma) LOC100792638 (gma) LOC100796273 (gma) LOC100804748 (gma) MSRA3 (sly) MSRA4 (sly) LOC103847055 (bra) LOC103855730 (bra) LOC103861530 (bra) | |||||||||||||||||||||||||
| Subcellular localization wolf |
|
|||||||||||||||||||||||||
| Subcellular localization TargetP |
|
|||||||||||||||||||||||||
| Gene coexpression | ||||||||||||||||||||||||||
| Network*for coexpressed genes |
|
|||||||||||||||||||||||||
|---|---|---|---|---|---|---|---|---|---|---|---|---|---|---|---|---|---|---|---|---|---|---|---|---|---|---|
| Coexpressed gene list |
[Coexpressed gene list for PMSR1] | |||||||||||||||||||||||||
| Gene expression | ||||||||||||||||||||||||||
| All samples | [Expression pattern for all samples] | |||||||||||||||||||||||||
| AtGenExpress* (Development) |
247514_at
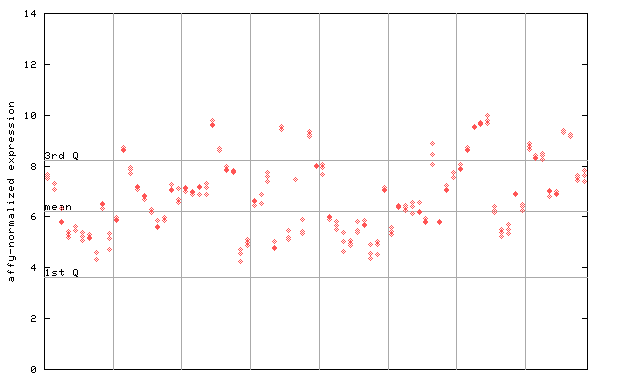
X axis is samples (pdf file), and Y axis is log2-expression. |
|||||||||||||||||||||||||
| AtGenExpress* (Stress) |
247514_at
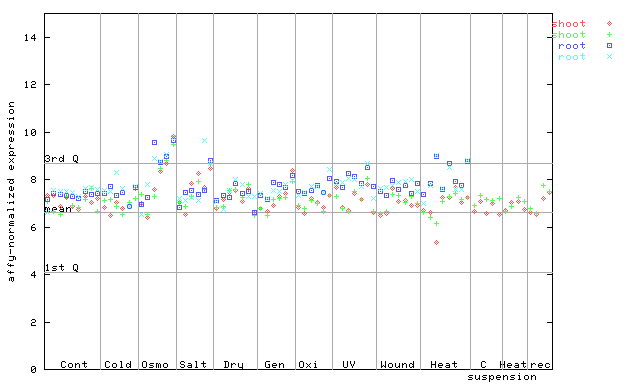
X axis is samples (pdf file), and Y axis is log2-expression. |
|||||||||||||||||||||||||
| AtGenExpress* (Hormone) |
247514_at
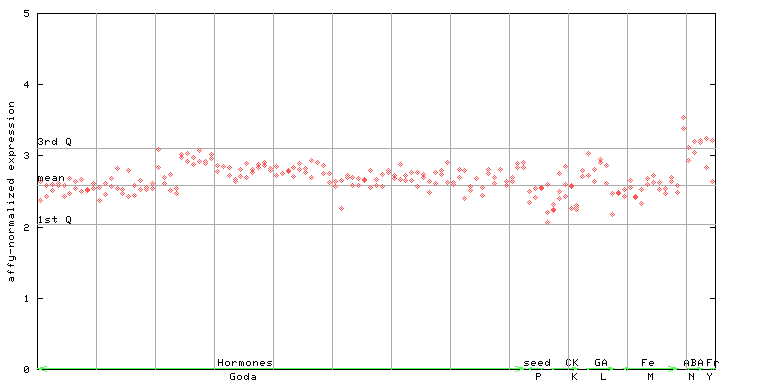
X axis is samples (xls file), and Y axis is log-expression. |
|||||||||||||||||||||||||


| Link to other DBs | ||
| Entrez Gene ID | 836286 |
|
| Refseq ID (protein) | NP_001331838.1 | |
| NP_568937.1 | |
|
The preparation time of this page was 0.2 [sec].