[←][→] ath
| functional annotation | ||||||||||||||
| Function | glutathione S-transferase tau 9 |


|
||||||||||||
| GO BP |
|
|||||||||||||
| GO CC |
|
|||||||||||||
| GO MF |
|
|||||||||||||
| KEGG | ath00480 [list] [network] Glutathione metabolism (102 genes) |  |
||||||||||||
| Protein | NP_001329956.1 NP_568954.2 NP_851249.1 | |||||||||||||
| BLAST | NP_001329956.1 NP_568954.2 NP_851249.1 | |||||||||||||
| Orthologous | [Ortholog page] LOC547581 (gma) GSTU10 (ath) LOC11418054 (mtr) LOC100243397 (vvi) LOC100250043 (vvi) LOC100260235 (vvi) LOC100260496 (vvi) LOC100263691 (vvi) LOC100265455 (vvi) LOC100265722 (vvi) LOC101248761 (sly) LOC101259327 (sly) LOC103831930 (bra) LOC103852912 (bra) LOC103874685 (bra) | |||||||||||||
| Subcellular localization wolf |
|
|||||||||||||
| Subcellular localization TargetP |
|
|||||||||||||
| Gene coexpression | ||||||||||||||
| Network*for coexpressed genes |
||||||||||||||
|---|---|---|---|---|---|---|---|---|---|---|---|---|---|---|
| Coexpressed gene list |
[Coexpressed gene list for GSTU9] | |||||||||||||
| Gene expression | ||||||||||||||
| All samples | [Expression pattern for all samples] | |||||||||||||
| AtGenExpress* (Development) |
247435_at
X axis is samples (pdf file), and Y axis is log2-expression. |
|||||||||||||
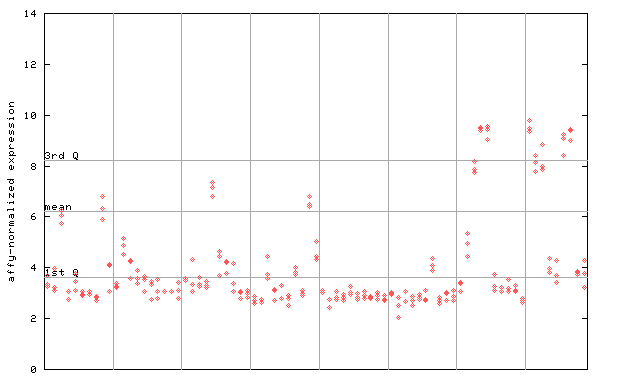
| AtGenExpress* (Stress) |
247435_at
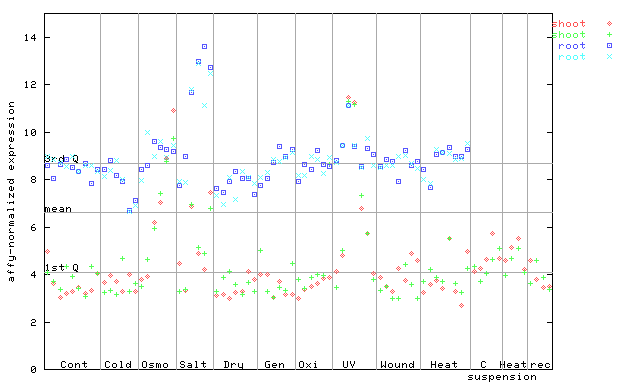
X axis is samples (pdf file), and Y axis is log2-expression. |
|||||||||||||
| AtGenExpress* (Hormone) |
247435_at
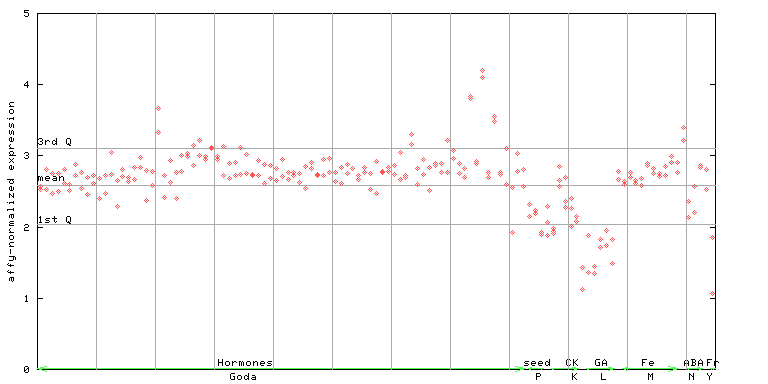
X axis is samples (xls file), and Y axis is log-expression. |
|||||||||||||


| Link to other DBs | ||
| Entrez Gene ID | 836368 |
|
| Refseq ID (protein) | NP_001329956.1 | |
| NP_568954.2 | |
|
| NP_851249.1 | |
|
The preparation time of this page was 0.2 [sec].