[←][→] ath
| functional annotation | |||||||||||||||||||||||||||||||
| Function | trichome birefringence-like protein (DUF828) |


|
|||||||||||||||||||||||||||||
| GO BP |
|
||||||||||||||||||||||||||||||
| GO CC |
|
||||||||||||||||||||||||||||||
| GO MF |
|
||||||||||||||||||||||||||||||
| KEGG | |||||||||||||||||||||||||||||||
| Protein | NP_001190614.1 NP_001330200.1 NP_201252.1 NP_851267.1 | ||||||||||||||||||||||||||||||
| BLAST | NP_001190614.1 NP_001330200.1 NP_201252.1 NP_851267.1 | ||||||||||||||||||||||||||||||
| Orthologous | [Ortholog page] LOC4328093 (osa) LOC7470784 (ppo) LOC11413348 (mtr) LOC100797317 (gma) LOC101259585 (sly) LOC102664482 (gma) LOC103873871 (bra) LOC123129357 (tae) LOC123131800 (tae) LOC123135683 (tae) LOC123138773 (tae) LOC123143252 (tae) LOC123143253 (tae) LOC123403665 (hvu) | ||||||||||||||||||||||||||||||
| Subcellular localization wolf |
|
||||||||||||||||||||||||||||||
| Subcellular localization TargetP |
|
||||||||||||||||||||||||||||||
| Gene coexpression | |||||||||||||||||||||||||||||||
| Network*for coexpressed genes |
|
||||||||||||||||||||||||||||||
|---|---|---|---|---|---|---|---|---|---|---|---|---|---|---|---|---|---|---|---|---|---|---|---|---|---|---|---|---|---|---|---|
| Coexpressed gene list |
[Coexpressed gene list for TBL12] | ||||||||||||||||||||||||||||||
| Gene expression | |||||||||||||||||||||||||||||||
| All samples | [Expression pattern for all samples] | ||||||||||||||||||||||||||||||
| AtGenExpress* (Development) |
247263_at
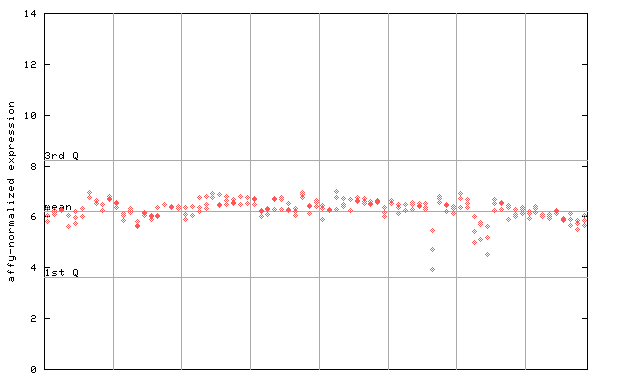
X axis is samples (pdf file), and Y axis is log2-expression. |
||||||||||||||||||||||||||||||
| AtGenExpress* (Stress) |
247263_at
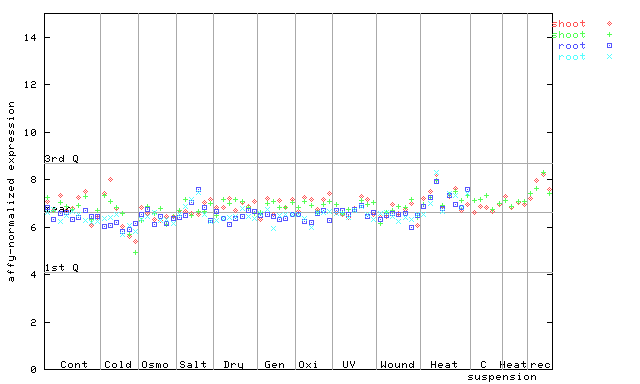
X axis is samples (pdf file), and Y axis is log2-expression. |
||||||||||||||||||||||||||||||
| AtGenExpress* (Hormone) |
247263_at
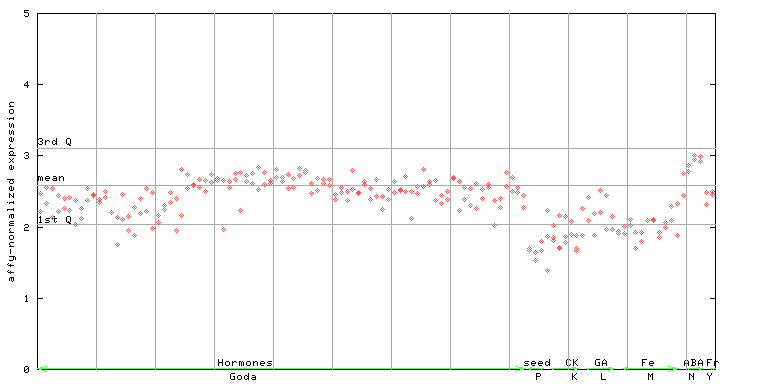
X axis is samples (xls file), and Y axis is log-expression. |
||||||||||||||||||||||||||||||


| Link to other DBs | ||
| Entrez Gene ID | 836568 |
|
| Refseq ID (protein) | NP_001190614.1 | |
| NP_001330200.1 | |
|
| NP_201252.1 | |
|
| NP_851267.1 | |
|
The preparation time of this page was 0.1 [sec].