[←][→] ath
| functional annotation | ||||||||||||||||||||||||||||||||||||||||||||||||||||||||||||||||
| Function | disproportionating enzyme |

 Plant GARDEN Plant GARDEN JBrowse
|
||||||||||||||||||||||||||||||||||||||||||||||||||||||||||||||
| GO BP |
|
|||||||||||||||||||||||||||||||||||||||||||||||||||||||||||||||
| GO CC |
|
|||||||||||||||||||||||||||||||||||||||||||||||||||||||||||||||
| GO MF |
|
|||||||||||||||||||||||||||||||||||||||||||||||||||||||||||||||
| KEGG | ath00500 [list] [network] Starch and sucrose metabolism (172 genes) |  |
||||||||||||||||||||||||||||||||||||||||||||||||||||||||||||||
| Protein | NP_201291.1 | |||||||||||||||||||||||||||||||||||||||||||||||||||||||||||||||
| BLAST | NP_201291.1 | |||||||||||||||||||||||||||||||||||||||||||||||||||||||||||||||
| Orthologous | [Ortholog page] LOC780606 (tae) LOC4343975 (osa) LOC7456959 (ppo) LOC11440463 (mtr) LOC100785271 (gma) LOC100795007 (gma) LOC101250983 (sly) LOC103837558 (bra) LOC123044125 (tae) LOC123052006 (tae) LOC123425210 (hvu) | |||||||||||||||||||||||||||||||||||||||||||||||||||||||||||||||
| Subcellular localization wolf |
|
|||||||||||||||||||||||||||||||||||||||||||||||||||||||||||||||
| Subcellular localization TargetP |
|
|||||||||||||||||||||||||||||||||||||||||||||||||||||||||||||||
| Gene coexpression | ||||||||||||||||||||||||||||||||||||||||||||||||||||||||||||||||
| Network*for coexpressed genes |
|
|||||||||||||||||||||||||||||||||||||||||||||||||||||||||||||||
|---|---|---|---|---|---|---|---|---|---|---|---|---|---|---|---|---|---|---|---|---|---|---|---|---|---|---|---|---|---|---|---|---|---|---|---|---|---|---|---|---|---|---|---|---|---|---|---|---|---|---|---|---|---|---|---|---|---|---|---|---|---|---|---|---|
| Coexpressed gene list |
[Coexpressed gene list for DPE1] | |||||||||||||||||||||||||||||||||||||||||||||||||||||||||||||||
| Gene expression | ||||||||||||||||||||||||||||||||||||||||||||||||||||||||||||||||
| All samples | [Expression pattern for all samples] | |||||||||||||||||||||||||||||||||||||||||||||||||||||||||||||||
| AtGenExpress* (Development) |
247216_at
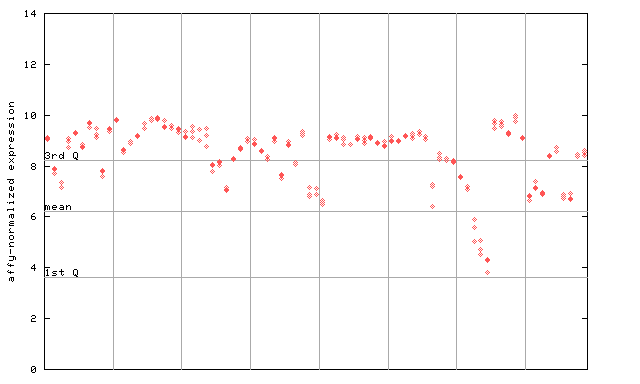
X axis is samples (pdf file), and Y axis is log2-expression. |
|||||||||||||||||||||||||||||||||||||||||||||||||||||||||||||||
| AtGenExpress* (Stress) |
247216_at
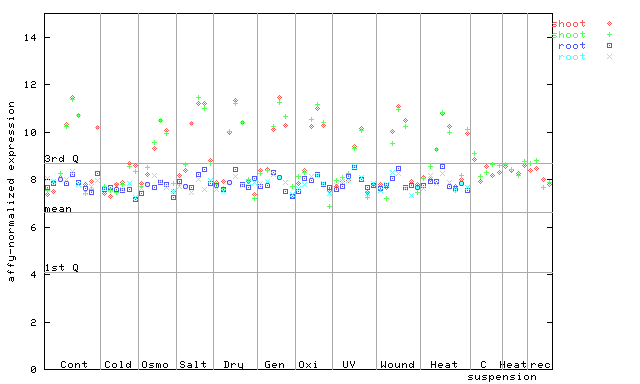
X axis is samples (pdf file), and Y axis is log2-expression. |
|||||||||||||||||||||||||||||||||||||||||||||||||||||||||||||||
| AtGenExpress* (Hormone) |
247216_at
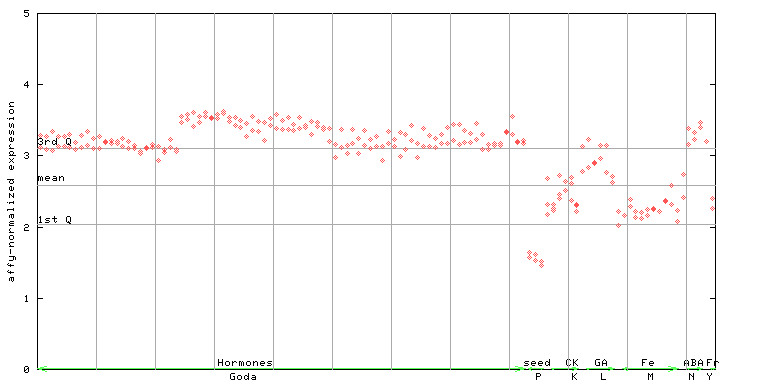
X axis is samples (xls file), and Y axis is log-expression. |
|||||||||||||||||||||||||||||||||||||||||||||||||||||||||||||||


")
| Link to other DBs | ||
| Entrez Gene ID | 836609 |
|
| Refseq ID (protein) | NP_201291.1 | |
The preparation time of this page was 0.1 [sec].