[←][→] ath
| functional annotation | ||||||||
| Function | Glycosyl hydrolase family 38 protein |


|
||||||
| GO BP |
|
|||||||
| GO CC |
|
|||||||
| GO MF |
|
|||||||
| KEGG | ath00511 [list] [network] Other glycan degradation (19 genes) |  |
||||||
| Protein | NP_001332004.1 NP_001332005.1 NP_201416.1 | |||||||
| BLAST | NP_001332004.1 NP_001332005.1 NP_201416.1 | |||||||
| Orthologous | [Ortholog page] LOC4348080 (osa) LOC11440154 (mtr) LOC18101098 (ppo) LOC100775419 (gma) LOC100806041 (gma) LOC100806748 (gma) LOC101263369 (sly) LOC103837673 (bra) LOC123111404 (tae) LOC123180408 (tae) LOC123190935 (tae) LOC123424592 (hvu) | |||||||
| Subcellular localization wolf |
|
|||||||
| Subcellular localization TargetP |
|
|||||||
| Gene coexpression | ||||||||
| Network*for coexpressed genes |
||||||||
|---|---|---|---|---|---|---|---|---|
| Coexpressed gene list |
[Coexpressed gene list for AT5G66150] | |||||||
| Gene expression | ||||||||
| All samples | [Expression pattern for all samples] | |||||||
| AtGenExpress* (Development) |
247129_at
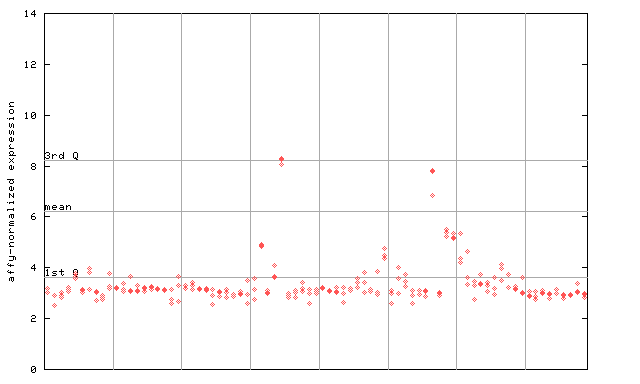
X axis is samples (pdf file), and Y axis is log2-expression. |
|||||||
| AtGenExpress* (Stress) |
247129_at
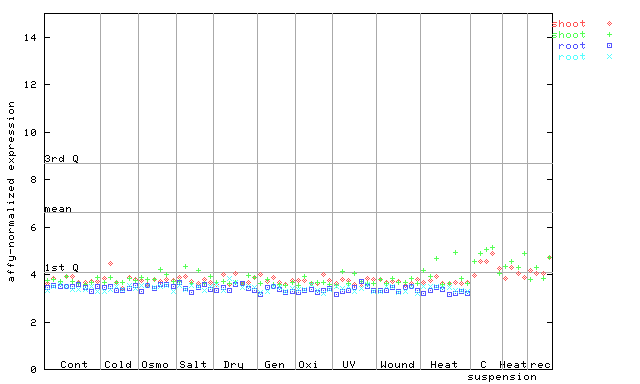
X axis is samples (pdf file), and Y axis is log2-expression. |
|||||||
| AtGenExpress* (Hormone) |
247129_at
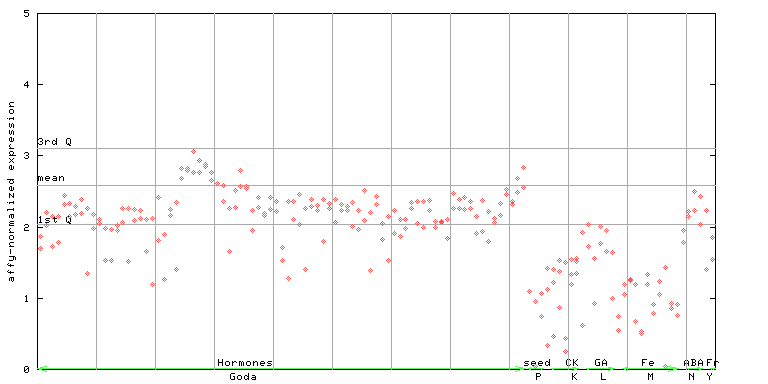
X axis is samples (xls file), and Y axis is log-expression. |
|||||||

| Link to other DBs | ||
| Entrez Gene ID | 836747 |
|
| Refseq ID (protein) | NP_001332004.1 | |
| NP_001332005.1 | |
|
| NP_201416.1 | |
|
The preparation time of this page was 0.1 [sec].