[←][→] ath
| functional annotation | ||||||||||||||||||||||||||||||||||
| Function | transmembrane protein |


|
||||||||||||||||||||||||||||||||
| GO BP |
|
|||||||||||||||||||||||||||||||||
| GO CC |
|
|||||||||||||||||||||||||||||||||
| GO MF |
|
|||||||||||||||||||||||||||||||||
| KEGG | ||||||||||||||||||||||||||||||||||
| Protein | NP_201483.2 | |||||||||||||||||||||||||||||||||
| BLAST | NP_201483.2 | |||||||||||||||||||||||||||||||||
| Orthologous | [Ortholog page] LOC4331871 (osa) LOC7480504 (ppo) LOC7483128 (ppo) LOC100795770 (gma) LOC100814143 (gma) LOC100853492 (vvi) LOC101249796 (sly) LOC103631819 (zma) LOC103829560 (bra) LOC104878532 (vvi) LOC109942772 (zma) LOC112421812 (mtr) | |||||||||||||||||||||||||||||||||
| Subcellular localization wolf |
|
|||||||||||||||||||||||||||||||||
| Subcellular localization TargetP |
|
|||||||||||||||||||||||||||||||||
| Gene coexpression | ||||||||||||||||||||||||||||||||||
| Network*for coexpressed genes |
|
|||||||||||||||||||||||||||||||||
|---|---|---|---|---|---|---|---|---|---|---|---|---|---|---|---|---|---|---|---|---|---|---|---|---|---|---|---|---|---|---|---|---|---|---|
| Coexpressed gene list |
[Coexpressed gene list for AT5G66820] | |||||||||||||||||||||||||||||||||
| Gene expression | ||||||||||||||||||||||||||||||||||
| All samples | [Expression pattern for all samples] | |||||||||||||||||||||||||||||||||
| AtGenExpress* (Development) |
247063_at
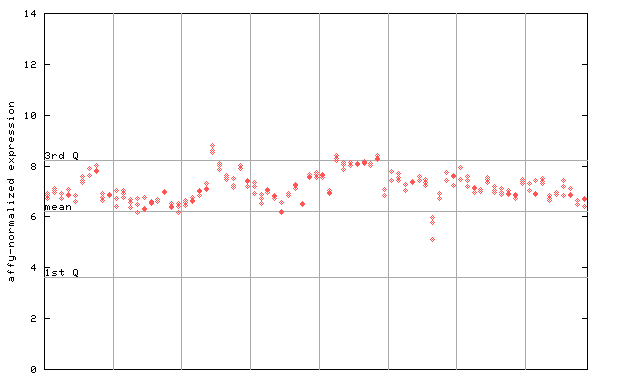
X axis is samples (pdf file), and Y axis is log2-expression. |
|||||||||||||||||||||||||||||||||
| AtGenExpress* (Stress) |
247063_at
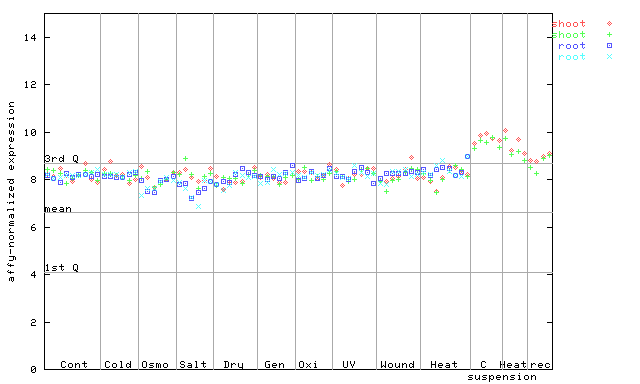
X axis is samples (pdf file), and Y axis is log2-expression. |
|||||||||||||||||||||||||||||||||
| AtGenExpress* (Hormone) |
247063_at
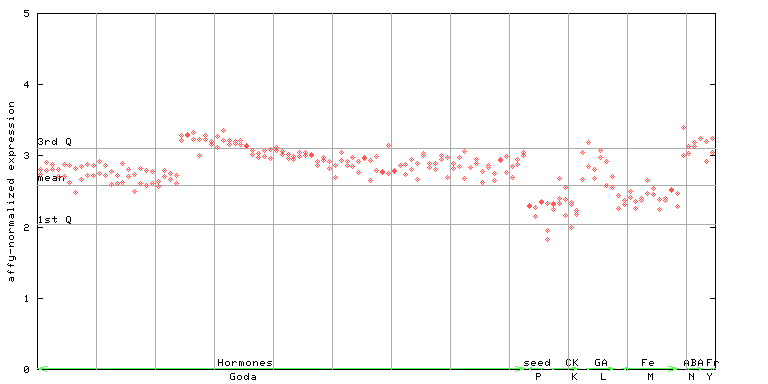
X axis is samples (xls file), and Y axis is log-expression. |
|||||||||||||||||||||||||||||||||


")
| Link to other DBs | ||
| Entrez Gene ID | 836816 |
|
| Refseq ID (protein) | NP_201483.2 | |
The preparation time of this page was 0.2 [sec].