[←][→] ath
| functional annotation | ||||||||||||||||||||||||||||||||||||||||||||||||||||
| Function | plastocyanin 1 |


|
||||||||||||||||||||||||||||||||||||||||||||||||||
| GO BP |
|
|||||||||||||||||||||||||||||||||||||||||||||||||||
| GO CC |
|
|||||||||||||||||||||||||||||||||||||||||||||||||||
| GO MF |
|
|||||||||||||||||||||||||||||||||||||||||||||||||||
| KEGG | ath00195 [list] [network] Photosynthesis (77 genes) |  |
||||||||||||||||||||||||||||||||||||||||||||||||||
| Protein | NP_001321069.1 NP_177737.1 | |||||||||||||||||||||||||||||||||||||||||||||||||||
| BLAST | NP_001321069.1 NP_177737.1 | |||||||||||||||||||||||||||||||||||||||||||||||||||
| Orthologous | [Ortholog page] PETE (sly) DRT112 (ath) LOC4339833 (osa) LOC7485623 (ppo) LOC7496895 (ppo) LOC11426844 (mtr) LOC100306554 (gma) LOC100499708 (gma) LOC103832056 (bra) LOC103835801 (bra) LOC103872830 (bra) LOC123088670 (tae) LOC123150017 (tae) LOC123165221 (tae) LOC123411665 (hvu) | |||||||||||||||||||||||||||||||||||||||||||||||||||
| Subcellular localization wolf |
|
|||||||||||||||||||||||||||||||||||||||||||||||||||
| Subcellular localization TargetP |
|
|||||||||||||||||||||||||||||||||||||||||||||||||||
| Gene coexpression | ||||||||||||||||||||||||||||||||||||||||||||||||||||
| Network*for coexpressed genes |
|
|||||||||||||||||||||||||||||||||||||||||||||||||||
|---|---|---|---|---|---|---|---|---|---|---|---|---|---|---|---|---|---|---|---|---|---|---|---|---|---|---|---|---|---|---|---|---|---|---|---|---|---|---|---|---|---|---|---|---|---|---|---|---|---|---|---|---|
| Coexpressed gene list |
[Coexpressed gene list for PETE1] | |||||||||||||||||||||||||||||||||||||||||||||||||||
| Gene expression | ||||||||||||||||||||||||||||||||||||||||||||||||||||
| All samples | [Expression pattern for all samples] | |||||||||||||||||||||||||||||||||||||||||||||||||||
| AtGenExpress* (Development) |
261769_at
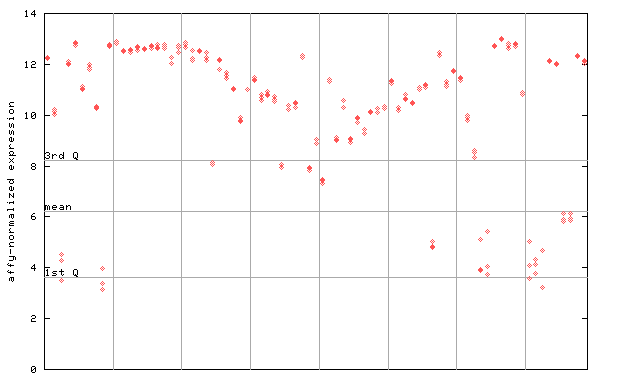
X axis is samples (pdf file), and Y axis is log2-expression. |
|||||||||||||||||||||||||||||||||||||||||||||||||||
| AtGenExpress* (Stress) |
261769_at
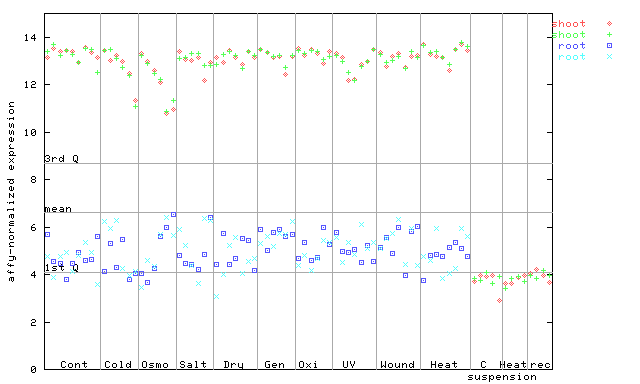
X axis is samples (pdf file), and Y axis is log2-expression. |
|||||||||||||||||||||||||||||||||||||||||||||||||||
| AtGenExpress* (Hormone) |
261769_at
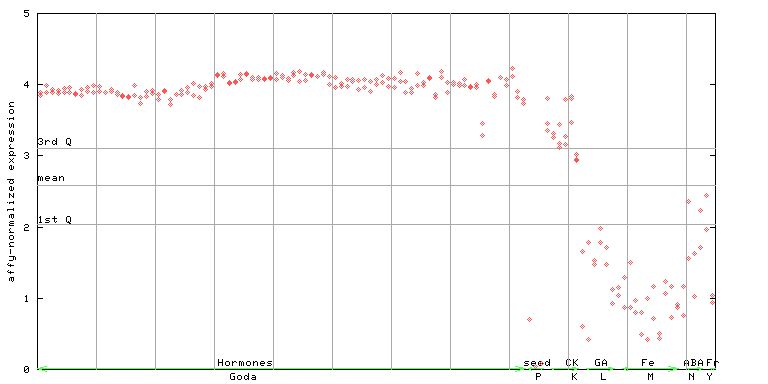
X axis is samples (xls file), and Y axis is log-expression. |
|||||||||||||||||||||||||||||||||||||||||||||||||||


")
")
")
| Link to other DBs | ||
| Entrez Gene ID | 843942 |
|
| Refseq ID (protein) | NP_001321069.1 | |
| NP_177737.1 | |
|
The preparation time of this page was 0.1 [sec].