[←][→] ath
| functional annotation | ||||||||||||||||||||||||||||||||||||||
| Function | thioredoxin Y1 |


|
||||||||||||||||||||||||||||||||||||
| GO BP |
|
|||||||||||||||||||||||||||||||||||||
| GO CC |
|
|||||||||||||||||||||||||||||||||||||
| GO MF |
|
|||||||||||||||||||||||||||||||||||||
| KEGG | ||||||||||||||||||||||||||||||||||||||
| Protein | NP_177802.2 | |||||||||||||||||||||||||||||||||||||
| BLAST | NP_177802.2 | |||||||||||||||||||||||||||||||||||||
| Orthologous | [Ortholog page] ty2 (ath) LOC4324458 (osa) LOC7467809 (ppo) LOC7469227 (ppo) LOC11408544 (mtr) LOC100306580 (gma) LOC100500683 (gma) LOC101246132 (sly) LOC103832129 (bra) LOC123063564 (tae) LOC123072694 (tae) LOC123080877 (tae) LOC123445613 (hvu) | |||||||||||||||||||||||||||||||||||||
| Subcellular localization wolf |
|
|||||||||||||||||||||||||||||||||||||
| Subcellular localization TargetP |
|
|||||||||||||||||||||||||||||||||||||
| Gene coexpression | ||||||||||||||||||||||||||||||||||||||
| Network*for coexpressed genes |
|
|||||||||||||||||||||||||||||||||||||
|---|---|---|---|---|---|---|---|---|---|---|---|---|---|---|---|---|---|---|---|---|---|---|---|---|---|---|---|---|---|---|---|---|---|---|---|---|---|---|
| Coexpressed gene list |
[Coexpressed gene list for TY1] | |||||||||||||||||||||||||||||||||||||
| Gene expression | ||||||||||||||||||||||||||||||||||||||
| All samples | [Expression pattern for all samples] | |||||||||||||||||||||||||||||||||||||
| AtGenExpress* (Development) |
259868_at
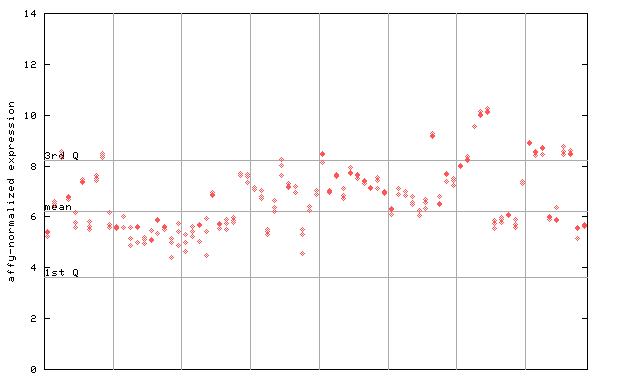
X axis is samples (pdf file), and Y axis is log2-expression. |
|||||||||||||||||||||||||||||||||||||
| AtGenExpress* (Stress) |
259868_at
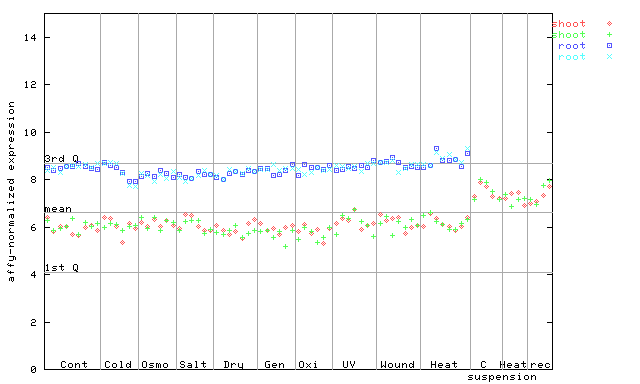
X axis is samples (pdf file), and Y axis is log2-expression. |
|||||||||||||||||||||||||||||||||||||
| AtGenExpress* (Hormone) |
259868_at
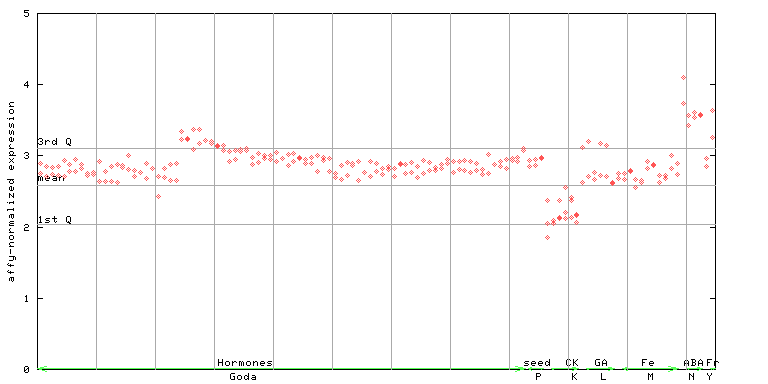
X axis is samples (xls file), and Y axis is log-expression. |
|||||||||||||||||||||||||||||||||||||


")
")
| Link to other DBs | ||
| Entrez Gene ID | 844010 |
|
| Refseq ID (protein) | NP_177802.2 | |
The preparation time of this page was 0.2 [sec].