[←][→] ath
| functional annotation | |||||||||||||||||||||||||||||||||||||||
| Function | thioredoxin O1 |


|
|||||||||||||||||||||||||||||||||||||
| GO BP |
|
||||||||||||||||||||||||||||||||||||||
| GO CC |
|
||||||||||||||||||||||||||||||||||||||
| GO MF |
|
||||||||||||||||||||||||||||||||||||||
| KEGG | |||||||||||||||||||||||||||||||||||||||
| Protein | NP_001078006.1 NP_181046.1 | ||||||||||||||||||||||||||||||||||||||
| BLAST | NP_001078006.1 NP_181046.1 | ||||||||||||||||||||||||||||||||||||||
| Orthologous | [Ortholog page] TO2 (ath) LOC9266617 (osa) LOC18094635 (ppo) LOC25493422 (mtr) LOC100500492 (gma) LOC100799935 (gma) LOC101262775 (sly) LOC103840275 (bra) LOC103865369 (bra) LOC123149213 (tae) LOC123159253 (tae) LOC123168634 (tae) LOC123412095 (hvu) | ||||||||||||||||||||||||||||||||||||||
| Subcellular localization wolf |
|
||||||||||||||||||||||||||||||||||||||
| Subcellular localization TargetP |
|
||||||||||||||||||||||||||||||||||||||
| Gene coexpression | |||||||||||||||||||||||||||||||||||||||
| Network*for coexpressed genes |
|
||||||||||||||||||||||||||||||||||||||
|---|---|---|---|---|---|---|---|---|---|---|---|---|---|---|---|---|---|---|---|---|---|---|---|---|---|---|---|---|---|---|---|---|---|---|---|---|---|---|---|
| Coexpressed gene list |
[Coexpressed gene list for TO1] | ||||||||||||||||||||||||||||||||||||||
| Gene expression | |||||||||||||||||||||||||||||||||||||||
| All samples | [Expression pattern for all samples] | ||||||||||||||||||||||||||||||||||||||
| AtGenExpress* (Development) |
267419_at
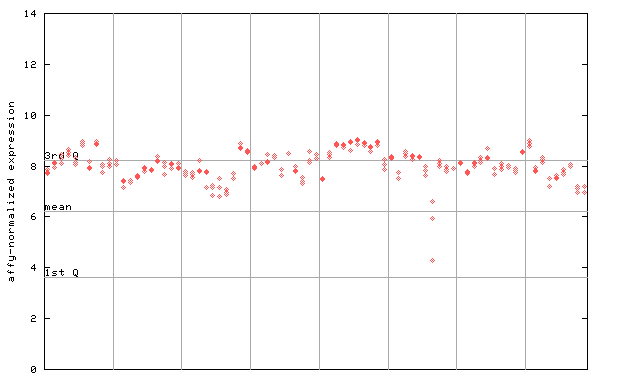
X axis is samples (pdf file), and Y axis is log2-expression. |
||||||||||||||||||||||||||||||||||||||
| AtGenExpress* (Stress) |
267419_at
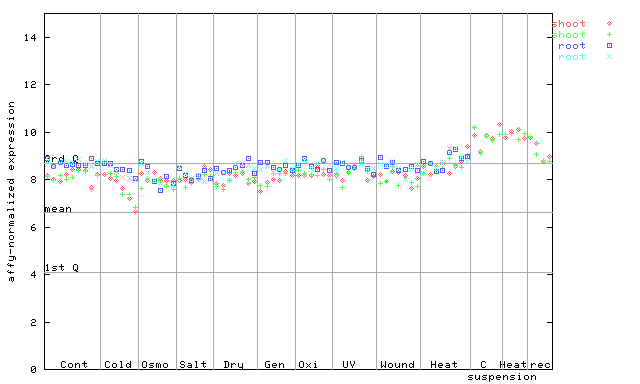
X axis is samples (pdf file), and Y axis is log2-expression. |
||||||||||||||||||||||||||||||||||||||
| AtGenExpress* (Hormone) |
267419_at
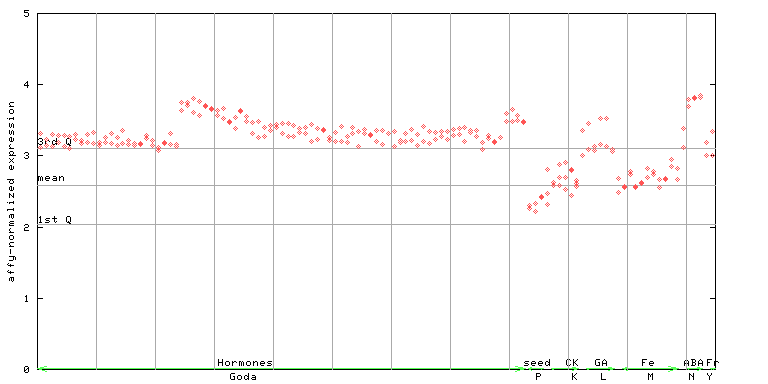
X axis is samples (xls file), and Y axis is log-expression. |
||||||||||||||||||||||||||||||||||||||


")
| Link to other DBs | ||
| Entrez Gene ID | 818065 |
|
| Refseq ID (protein) | NP_001078006.1 | |
| NP_181046.1 | |
|
The preparation time of this page was 0.1 [sec].