[←][→] ath
| functional annotation | ||||||||||||||||||||||||||||||||||||
| Function | Peroxidase superfamily protein |


|
||||||||||||||||||||||||||||||||||
| GO BP |
|
|||||||||||||||||||||||||||||||||||
| GO CC |
|
|||||||||||||||||||||||||||||||||||
| GO MF |
|
|||||||||||||||||||||||||||||||||||
| KEGG | ath00940 [list] [network] Phenylpropanoid biosynthesis (128 genes) |  |
||||||||||||||||||||||||||||||||||
| Protein | NP_197795.1 | |||||||||||||||||||||||||||||||||||
| BLAST | NP_197795.1 | |||||||||||||||||||||||||||||||||||
| Orthologous | [Ortholog page] AT2G43480 (ath) LOC7491729 (ppo) LOC25487914 (mtr) LOC100797875 (gma) LOC100820410 (gma) LOC101246453 (sly) LOC103866074 (bra) LOC103874275 (bra) | |||||||||||||||||||||||||||||||||||
| Subcellular localization wolf |
|
|||||||||||||||||||||||||||||||||||
| Subcellular localization TargetP |
|
|||||||||||||||||||||||||||||||||||
| Gene coexpression | ||||||||||||||||||||||||||||||||||||
| Network*for coexpressed genes |
|
|||||||||||||||||||||||||||||||||||
|---|---|---|---|---|---|---|---|---|---|---|---|---|---|---|---|---|---|---|---|---|---|---|---|---|---|---|---|---|---|---|---|---|---|---|---|---|
| Coexpressed gene list |
[Coexpressed gene list for AT5G24070] | |||||||||||||||||||||||||||||||||||
| Gene expression | ||||||||||||||||||||||||||||||||||||
| All samples | [Expression pattern for all samples] | |||||||||||||||||||||||||||||||||||
| AtGenExpress* (Development) |
249766_at
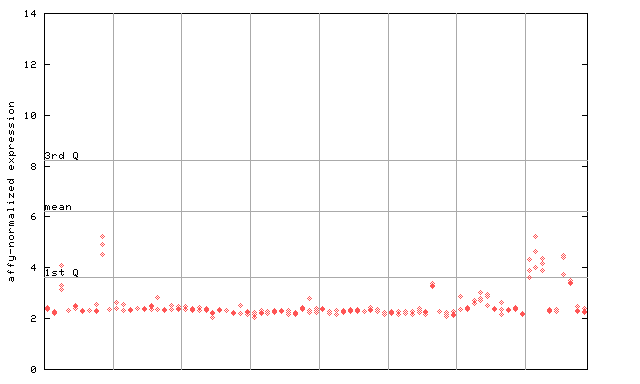
X axis is samples (pdf file), and Y axis is log2-expression. |
|||||||||||||||||||||||||||||||||||
| AtGenExpress* (Stress) |
249766_at
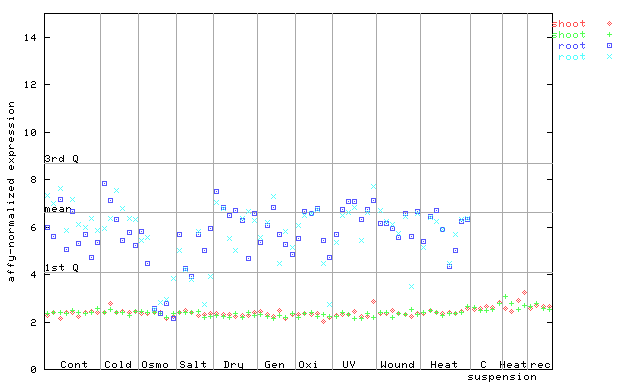
X axis is samples (pdf file), and Y axis is log2-expression. |
|||||||||||||||||||||||||||||||||||
| AtGenExpress* (Hormone) |
249766_at
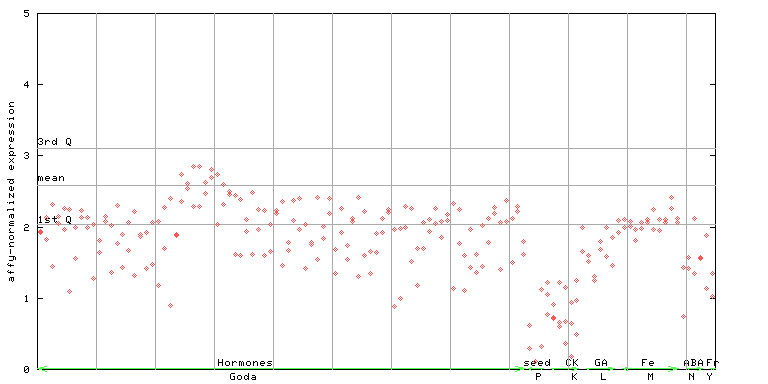
X axis is samples (xls file), and Y axis is log-expression. |
|||||||||||||||||||||||||||||||||||


| Link to other DBs | ||
| Entrez Gene ID | 832472 |
|
| Refseq ID (protein) | NP_197795.1 | |
The preparation time of this page was 0.1 [sec].