| functional annotation |
| Function |
NAC domain containing protein 1 |


|
| GO BP |
|
GO:0010038 [list] [network] response to metal ion
|
(256 genes)
|
IEA
|
 |
|
GO:0071396 [list] [network] cellular response to lipid
|
(522 genes)
|
IEA
|
 |
|
GO:0019748 [list] [network] secondary metabolic process
|
(766 genes)
|
IEA
|
 |
|
GO:0042742 [list] [network] defense response to bacterium
|
(980 genes)
|
IEA
|
 |
|
GO:0009414 [list] [network] response to water deprivation
|
(1006 genes)
|
IEA
|
 |
|
GO:0009737 [list] [network] response to abscisic acid
|
(1086 genes)
|
IEA
|
 |
|
GO:1901701 [list] [network] cellular response to oxygen-containing compound
|
(1115 genes)
|
IEA
|
 |
|
GO:0032870 [list] [network] cellular response to hormone stimulus
|
(1136 genes)
|
IEA
|
 |
|
GO:0006355 [list] [network] regulation of DNA-templated transcription
|
(1656 genes)
|
IEA
ISS
|
 |
|
GO:0033993 [list] [network] response to lipid
|
(1939 genes)
|
IEA
|
 |
|
GO:0010035 [list] [network] response to inorganic substance
|
(2100 genes)
|
IEA
|
 |
|
| GO CC |
|
| GO MF |
|
GO:0000976 [list] [network] transcription cis-regulatory region binding
|
(708 genes)
|
IPI
|
 |
|
GO:0003700 [list] [network] DNA-binding transcription factor activity
|
(1576 genes)
|
ISS
|
 |
|
| KEGG |
|
|
| Protein |
NP_171609.1
|
| BLAST |
NP_171609.1
|
| Orthologous |
[Ortholog page]
LOC103844610 (bra)
|
Subcellular
localization
wolf |
|
cyto 2,
nucl 2,
golg 2,
cyto_pero 1,
vacu 1,
chlo 1,
E.R. 1
|
(predict for NP_171609.1)
|
|
Subcellular
localization
TargetP |
|
other 9
|
(predict for NP_171609.1)
|
|
| Gene coexpression |
Network*for
coexpressed
genes |
| KEGG* ID |
Title |
#genes |
Link to the KEGG* map
(Multiple genes) |
| ath00480 |
Glutathione metabolism |
8 |
 |
Genes directly connected with NAC001 on the network
| coex z* |
Locus |
Function* |
CoexViewer |
Entrez Gene ID* |
| 4.6 |
AT1G60730 |
NAD(P)-linked oxidoreductase superfamily protein |
[detail] |
842367 |
| 4.3 |
GSTU24 |
glutathione S-transferase TAU 24 |
[detail] |
838288 |
| 4.2 |
GSTU1 |
glutathione S-transferase TAU 1 |
[detail] |
817498 |
|
Coexpressed
gene list |
[Coexpressed gene list for NAC001]
|
| Gene expression |
| All samples |
[Expression pattern for all samples]
|
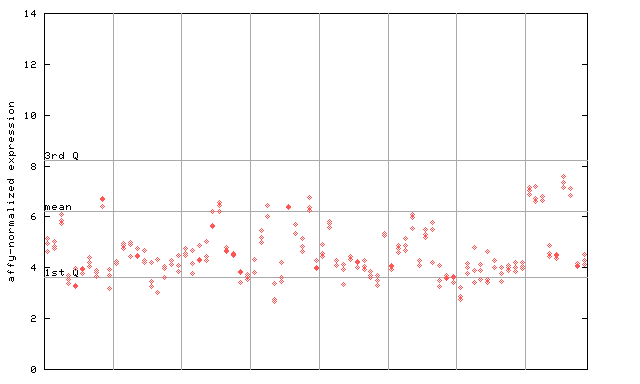
AtGenExpress*
(Development) |
261585_at

X axis is samples (pdf file), and Y axis is log2-expression.
"1st Q", "mean" and "3rd Q" indecate the values for all genes on a GeneChip. Q: quartile.
|
AtGenExpress*
(Stress) |
261585_at

X axis is samples (pdf file), and Y axis is log2-expression.
|
AtGenExpress*
(Hormone) |
261585_at

X axis is samples (xls file), and Y axis is log-expression.
|


