| functional annotation |
| Function |
NAD(P)-binding Rossmann-fold superfamily protein |


|
| GO BP |
|
GO:0031129 [list] [network] inductive cell-cell signaling
|
(1 genes)
|
IMP
|
 |
|
GO:0010482 [list] [network] regulation of epidermal cell division
|
(3 genes)
|
IMP
|
 |
|
GO:0034063 [list] [network] stress granule assembly
|
(3 genes)
|
IMP
|
 |
|
GO:0042814 [list] [network] monopolar cell growth
|
(3 genes)
|
IMP
|
 |
|
GO:0045604 [list] [network] regulation of epidermal cell differentiation
|
(4 genes)
|
IMP
|
 |
|
GO:0048530 [list] [network] fruit morphogenesis
|
(5 genes)
|
IMP
|
 |
|
GO:2000039 [list] [network] regulation of trichome morphogenesis
|
(5 genes)
|
IMP
|
 |
|
GO:0007097 [list] [network] nuclear migration
|
(8 genes)
|
IMP
|
 |
|
GO:0008360 [list] [network] regulation of cell shape
|
(9 genes)
|
IMP
|
 |
|
GO:0010091 [list] [network] trichome branching
|
(31 genes)
|
IMP
|
 |
|
GO:0048444 [list] [network] floral organ morphogenesis
|
(48 genes)
|
IMP
|
 |
|
GO:0009965 [list] [network] leaf morphogenesis
|
(102 genes)
|
IMP
|
 |
|
GO:0000226 [list] [network] microtubule cytoskeleton organization
|
(106 genes)
|
IMP
|
 |
|
GO:0009651 [list] [network] response to salt stress
|
(607 genes)
|
IMP
|
 |
|
GO:0006970 [list] [network] response to osmotic stress
|
(883 genes)
|
IMP
|
 |
|
| GO CC |
|
| GO MF |
|
GO:0003714 [list] [network] transcription corepressor activity
|
(17 genes)
|
IEA
|
 |
|
GO:0051287 [list] [network] NAD binding
|
(29 genes)
|
IEA
|
 |
|
GO:0016616 [list] [network] oxidoreductase activity, acting on the CH-OH group of donors, NAD or NADP as acceptor
|
(109 genes)
|
IEA
|
 |
|
GO:0043621 [list] [network] protein self-association
|
(109 genes)
|
IPI
|
 |
|
GO:0019900 [list] [network] kinase binding
|
(110 genes)
|
IPI
|
 |
|
GO:0042803 [list] [network] protein homodimerization activity
|
(227 genes)
|
IDA
|
 |
|
GO:0042802 [list] [network] identical protein binding
|
(404 genes)
|
IPI
|
 |
|
GO:0005515 [list] [network] protein binding
|
(5066 genes)
|
IPI
|
 |
|
| KEGG |
|
|
| Protein |
NP_563629.1
|
| BLAST |
NP_563629.1
|
| Orthologous |
[Ortholog page]
LOC4331469 (osa)
LOC4349220 (osa)
LOC7494111 (ppo)
LOC7497223 (ppo)
LOC11405168 (mtr)
LOC100799136 (gma)
LOC100819434 (gma)
LOC101253532 (sly)
LOC103844655 (bra)
LOC123049324 (tae)
LOC123093545 (tae)
LOC123098816 (tae)
LOC123105772 (tae)
LOC123123459 (tae)
LOC123181410 (tae)
LOC123435395 (hvu)
LOC123449818 (hvu)
|
Subcellular
localization
wolf |
|
chlo 4,
nucl 2,
cysk 2,
cysk_nucl 2
|
(predict for NP_563629.1)
|
|
Subcellular
localization
TargetP |
|
other 5
|
(predict for NP_563629.1)
|
|
| Gene coexpression |
Network*for
coexpressed
genes |
Genes directly connected with AN on the network
| coex z* |
Locus |
Function* |
CoexViewer |
Entrez Gene ID* |
| 8.2 |
AT1G48950 |
C3HC zinc finger-like protein |
[detail] |
841317 |
| 8.0 |
AT1G07970 |
cytochrome B561, amino-terminal protein |
[detail] |
837312 |
| 7.5 |
AT5G01020 |
Protein kinase superfamily protein |
[detail] |
831918 |
| 7.5 |
TOR1 |
ARM repeat superfamily protein |
[detail] |
828814 |
| 7.4 |
ERH3 |
P-loop containing nucleoside triphosphate hydrolases superfamily protein |
[detail] |
844375 |
|
Coexpressed
gene list |
[Coexpressed gene list for AN]
|
| Gene expression |
| All samples |
[Expression pattern for all samples]
|
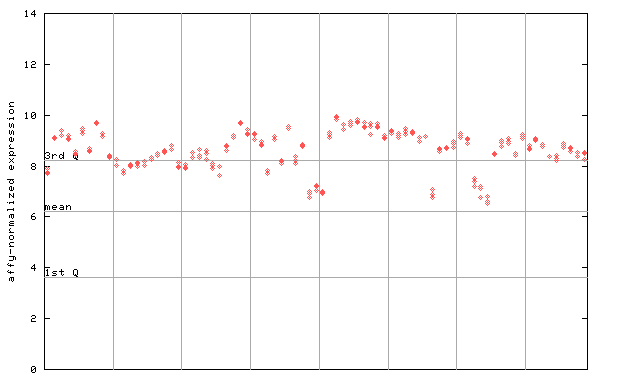
AtGenExpress*
(Development) |
259438_at

X axis is samples (pdf file), and Y axis is log2-expression.
"1st Q", "mean" and "3rd Q" indecate the values for all genes on a GeneChip. Q: quartile.
|
AtGenExpress*
(Stress) |
259438_at

X axis is samples (pdf file), and Y axis is log2-expression.
|
AtGenExpress*
(Hormone) |
259438_at

X axis is samples (xls file), and Y axis is log-expression.
|


