| functional annotation |
| Function |
phytochrome A |


|
| GO BP |
|
GO:0010203 [list] [network] response to very low fluence red light stimulus
|
(1 genes)
|
IMP
|
 |
|
GO:0010201 [list] [network] response to continuous far red light stimulus by the high-irradiance response system
|
(2 genes)
|
IMP
|
 |
|
GO:0009584 [list] [network] detection of visible light
|
(5 genes)
|
IEA
|
 |
|
GO:0017006 [list] [network] protein-tetrapyrrole linkage
|
(7 genes)
|
IEA
|
 |
|
GO:0010161 [list] [network] red light signaling pathway
|
(10 genes)
|
IMP
|
 |
|
GO:0046685 [list] [network] response to arsenic-containing substance
|
(18 genes)
|
IMP
|
 |
|
GO:0009585 [list] [network] red, far-red light phototransduction
|
(20 genes)
|
IEA
|
 |
|
GO:0017148 [list] [network] negative regulation of translation
|
(28 genes)
|
IMP
|
 |
|
GO:0009638 [list] [network] phototropism
|
(30 genes)
|
IMP
|
 |
|
GO:0010218 [list] [network] response to far red light
|
(48 genes)
|
IDA
ISS
|
 |
|
GO:0009640 [list] [network] photomorphogenesis
|
(80 genes)
|
IMP
|
 |
|
GO:0009630 [list] [network] gravitropism
|
(103 genes)
|
IMP
|
 |
|
GO:0006355 [list] [network] regulation of DNA-templated transcription
|
(1656 genes)
|
IEA
|
 |
|
| GO CC |
|
| GO MF |
|
GO:0031516 [list] [network] far-red light photoreceptor activity
|
(2 genes)
|
IMP
|
 |
|
GO:0009883 [list] [network] red or far-red light photoreceptor activity
|
(3 genes)
|
TAS
|
 |
|
GO:0000155 [list] [network] phosphorelay sensor kinase activity
|
(14 genes)
|
IEA
|
 |
|
GO:0004673 [list] [network] protein histidine kinase activity
|
(17 genes)
|
ISS
|
 |
|
GO:0042803 [list] [network] protein homodimerization activity
|
(227 genes)
|
IEA
|
 |
|
GO:0042802 [list] [network] identical protein binding
|
(404 genes)
|
IPI
|
 |
|
GO:0004672 [list] [network] protein kinase activity
|
(768 genes)
|
IDA
|
 |
|
GO:0003729 [list] [network] mRNA binding
|
(1535 genes)
|
HDA
|
 |
|
GO:0005515 [list] [network] protein binding
|
(5066 genes)
|
IPI
|
 |
|
| KEGG |
ath04712 [list] [network] Circadian rhythm - plant (39 genes) |
 |
| Protein |
NP_001117256.1
NP_001322906.1
NP_001322907.1
NP_001322908.1
NP_001322909.1
NP_172428.1
|
| BLAST |
NP_001117256.1
NP_001322906.1
NP_001322907.1
NP_001322908.1
NP_001322909.1
NP_172428.1
|
| Orthologous |
[Ortholog page]
phyA (sly)
PHYA (gma)
LOC4333930 (osa)
LOC7482219 (ppo)
LOC11405950 (mtr)
E4 (gma)
PHYA3 (gma)
LOC100873141 (tae)
LOC100873142 (tae)
LOC103843346 (bra)
LOC103871728 (bra)
LOC123447547 (hvu)
|
Subcellular
localization
wolf |
|
cyto 4,
nucl 2,
cyto_pero 2,
chlo 1,
cysk_nucl 1,
nucl_plas 1
|
(predict for NP_001117256.1)
|
|
nucl 4,
cyto 2,
nucl_plas 2,
chlo 1,
mito 1,
chlo_mito 1
|
(predict for NP_001322906.1)
|
|
chlo 4,
mito 3,
nucl 2,
cyto_mito 2
|
(predict for NP_001322907.1)
|
|
chlo 4,
mito 3,
nucl 2,
cyto_mito 2
|
(predict for NP_001322908.1)
|
|
chlo 4,
mito 3,
nucl 2,
cyto_mito 2
|
(predict for NP_001322909.1)
|
|
chlo 4,
mito 3,
nucl 2,
cyto_mito 2
|
(predict for NP_172428.1)
|
|
Subcellular
localization
TargetP |
|
other 6,
chlo 4
|
(predict for NP_001117256.1)
|
|
chlo 5,
mito 3
|
(predict for NP_001322906.1)
|
|
mito 5,
chlo 4
|
(predict for NP_001322907.1)
|
|
mito 5,
chlo 4
|
(predict for NP_001322908.1)
|
|
mito 5,
chlo 4
|
(predict for NP_001322909.1)
|
|
mito 5,
chlo 4
|
(predict for NP_172428.1)
|
|
| Gene coexpression |
Network*for
coexpressed
genes |
| KEGG* ID |
Title |
#genes |
Link to the KEGG* map
(Multiple genes) |
| ath04144 |
Endocytosis |
2 |
 |
Genes directly connected with PHYA on the network
| coex z* |
Locus |
Function* |
CoexViewer |
Entrez Gene ID* |
| 5.9 |
AT5G63190 |
MA3 domain-containing protein |
[detail] |
836440 |
| 5.6 |
ABCB19 |
ATP binding cassette subfamily B19 |
[detail] |
822519 |
| 5.3 |
GN |
sec7 domain-containing protein |
[detail] |
837958 |
| 5.1 |
GA3 |
GA requiring 3 |
[detail] |
832659 |
|
Coexpressed
gene list |
[Coexpressed gene list for PHYA]
|
| Gene expression |
| All samples |
[Expression pattern for all samples]
|
AtGenExpress*
(Development) |
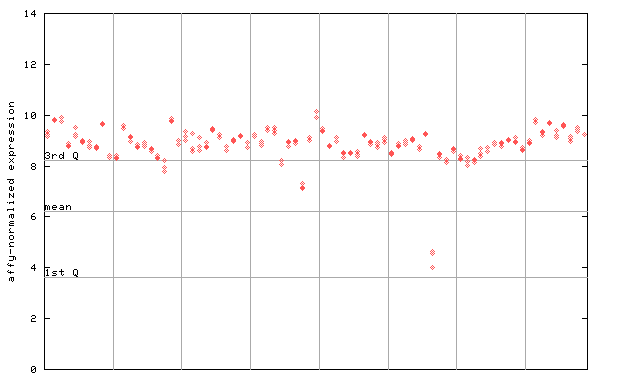
264508_at

X axis is samples (pdf file), and Y axis is log2-expression.
"1st Q", "mean" and "3rd Q" indecate the values for all genes on a GeneChip. Q: quartile.
|
AtGenExpress*
(Stress) |
264508_at

X axis is samples (pdf file), and Y axis is log2-expression.
|
AtGenExpress*
(Hormone) |
264508_at

X axis is samples (xls file), and Y axis is log-expression.
|


