[←][→] ath
| functional annotation | ||||||||||||||||||||||||||||||||||||||||||||||||||||||||||||||||||||||||||||||||||||||||||||||
| Function | glutathione S-transferase TAU 24 |


|
||||||||||||||||||||||||||||||||||||||||||||||||||||||||||||||||||||||||||||||||||||||||||||
| GO BP |
|
|||||||||||||||||||||||||||||||||||||||||||||||||||||||||||||||||||||||||||||||||||||||||||||
| GO CC |
|
|||||||||||||||||||||||||||||||||||||||||||||||||||||||||||||||||||||||||||||||||||||||||||||
| GO MF |
|
|||||||||||||||||||||||||||||||||||||||||||||||||||||||||||||||||||||||||||||||||||||||||||||
| KEGG | ath00480 [list] [network] Glutathione metabolism (103 genes) |  |
||||||||||||||||||||||||||||||||||||||||||||||||||||||||||||||||||||||||||||||||||||||||||||
| Protein | NP_173160.1 | |||||||||||||||||||||||||||||||||||||||||||||||||||||||||||||||||||||||||||||||||||||||||||||
| BLAST | NP_173160.1 | |||||||||||||||||||||||||||||||||||||||||||||||||||||||||||||||||||||||||||||||||||||||||||||
| Orthologous | [Ortholog page] LOC542991 (tae) LOC542992 (tae) BI-GST/GPX (sly) LOC543817 (sly) LOC543836 (sly) GSTa (gma) GSTU41 (gma) GST3 (gma) GSTU47 (gma) GSTU37 (gma) LOC548030 (gma) GSTU25 (ath) GSTU26 (ath) GSTU28 (ath) GSTU23 (ath) GSTU22 (ath) GSTU21 (ath) GSTU20 (ath) GSTU19 (ath) LOC4334347 (osa) LOC4343183 (osa) LOC4346877 (osa) LOC7454450 (ppo) LOC7459169 (ppo) LOC7459170 (ppo) LOC7459171 (ppo) LOC7459174 (ppo) LOC7490605 (ppo) LOC7491027 (ppo) LOC7491375 (ppo) LOC7491376 (ppo) LOC7491378 (ppo) LOC7494660 (ppo) LOC11407798 (mtr) LOC11443729 (mtr) LOC18095525 (ppo) LOC18103367 (ppo) LOC18103438 (ppo) LOC18108664 (ppo) LOC18108832 (ppo) LOC18109264 (ppo) LOC18109391 (ppo) LOC18109969 (ppo) LOC18109999 (ppo) LOC25480581 (mtr) LOC25487038 (mtr) LOC25487039 (mtr) LOC25487040 (mtr) LOC25487041 (mtr) LOC25487042 (mtr) LOC25487043 (mtr) LOC25487044 (mtr) LOC25487046 (mtr) LOC25487047 (mtr) LOC25487048 (mtr) LOC25491097 (mtr) LOC25491098 (mtr) LOC100037538 (tae) GSTU38 (gma) GSTU43 (gma) GSTU50 (gma) LOC100781460 (gma) LOC101244013 (sly) LOC101244300 (sly) LOC101244597 (sly) LOC101244886 (sly) LOC101245181 (sly) LOC101245473 (sly) LOC101255036 (sly) LOC101255338 (sly) LOC101265897 (sly) LOC101266195 (sly) LOC101266488 (sly) LOC103830523 (bra) LOC103830524 (bra) LOC103830525 (bra) LOC103830526 (bra) LOC103832315 (bra) LOC103832317 (bra) LOC103835969 (bra) LOC103842803 (bra) LOC103842804 (bra) LOC103842805 (bra) LOC103842808 (bra) LOC103853124 (bra) LOC103868413 (bra) LOC103872504 (bra) LOC103872505 (bra) LOC103872506 (bra) LOC106796199 (gma) LOC112323232 (ppo) LOC112323310 (ppo) LOC112327473 (ppo) LOC112327586 (ppo) LOC112327694 (ppo) LOC112327752 (ppo) LOC123042869 (tae) LOC123050743 (tae) LOC123058829 (tae) LOC123065990 (tae) LOC123075032 (tae) LOC123117115 (tae) LOC123125680 (tae) LOC123191137 (tae) LOC123398700 (hvu) LOC123431287 (hvu) LOC123440482 (hvu) LOC123452577 (hvu) | |||||||||||||||||||||||||||||||||||||||||||||||||||||||||||||||||||||||||||||||||||||||||||||
| Subcellular localization wolf |
|
|||||||||||||||||||||||||||||||||||||||||||||||||||||||||||||||||||||||||||||||||||||||||||||
| Subcellular localization TargetP |
|
|||||||||||||||||||||||||||||||||||||||||||||||||||||||||||||||||||||||||||||||||||||||||||||
| Gene coexpression | ||||||||||||||||||||||||||||||||||||||||||||||||||||||||||||||||||||||||||||||||||||||||||||||
| Network*for coexpressed genes |
|
|||||||||||||||||||||||||||||||||||||||||||||||||||||||||||||||||||||||||||||||||||||||||||||
|---|---|---|---|---|---|---|---|---|---|---|---|---|---|---|---|---|---|---|---|---|---|---|---|---|---|---|---|---|---|---|---|---|---|---|---|---|---|---|---|---|---|---|---|---|---|---|---|---|---|---|---|---|---|---|---|---|---|---|---|---|---|---|---|---|---|---|---|---|---|---|---|---|---|---|---|---|---|---|---|---|---|---|---|---|---|---|---|---|---|---|---|---|---|---|
| Coexpressed gene list |
[Coexpressed gene list for GSTU24] | |||||||||||||||||||||||||||||||||||||||||||||||||||||||||||||||||||||||||||||||||||||||||||||
| Gene expression | ||||||||||||||||||||||||||||||||||||||||||||||||||||||||||||||||||||||||||||||||||||||||||||||
| All samples | [Expression pattern for all samples] | |||||||||||||||||||||||||||||||||||||||||||||||||||||||||||||||||||||||||||||||||||||||||||||
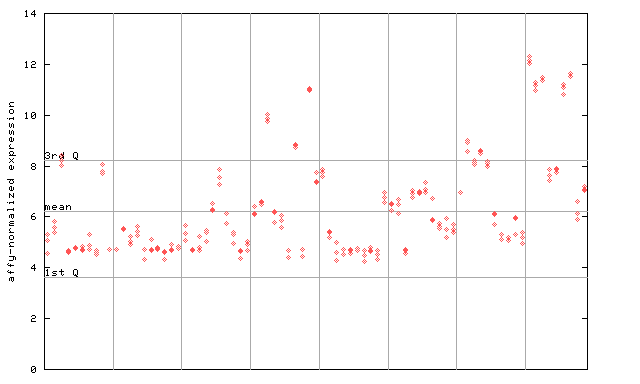
| AtGenExpress* (Development) |
262518_at

X axis is samples (pdf file), and Y axis is log2-expression. |
|||||||||||||||||||||||||||||||||||||||||||||||||||||||||||||||||||||||||||||||||||||||||||||
| AtGenExpress* (Stress) |
262518_at

X axis is samples (pdf file), and Y axis is log2-expression. |
|||||||||||||||||||||||||||||||||||||||||||||||||||||||||||||||||||||||||||||||||||||||||||||
| AtGenExpress* (Hormone) |
262518_at

X axis is samples (xls file), and Y axis is log-expression. |
|||||||||||||||||||||||||||||||||||||||||||||||||||||||||||||||||||||||||||||||||||||||||||||
| Link to other DBs | ||
| Entrez Gene ID | 838288 |


|
| Refseq ID (protein) | NP_173160.1 |  |
The preparation time of this page was 0.1 [sec].


