[←][→] ath
| functional annotation | |||||||||||||||||||||||||||||||||||||||||||||||||||||||||||||||||||||||||||||||||||||
| Function | sulfotransferase 17 |


|
|||||||||||||||||||||||||||||||||||||||||||||||||||||||||||||||||||||||||||||||||||
| GO BP |
|
||||||||||||||||||||||||||||||||||||||||||||||||||||||||||||||||||||||||||||||||||||
| GO CC |
|
||||||||||||||||||||||||||||||||||||||||||||||||||||||||||||||||||||||||||||||||||||
| GO MF |
|
||||||||||||||||||||||||||||||||||||||||||||||||||||||||||||||||||||||||||||||||||||
| KEGG | ath00966 [list] [network] Glucosinolate biosynthesis (26 genes) |  |
|||||||||||||||||||||||||||||||||||||||||||||||||||||||||||||||||||||||||||||||||||
| Protein | NP_173294.1 | ||||||||||||||||||||||||||||||||||||||||||||||||||||||||||||||||||||||||||||||||||||
| BLAST | NP_173294.1 | ||||||||||||||||||||||||||||||||||||||||||||||||||||||||||||||||||||||||||||||||||||
| Orthologous | [Ortholog page] AT2G03750 (ath) SOT12 (ath) AT2G03770 (ath) ST4A (ath) AT2G27570 (ath) AT3G45070 (ath) AT3G45080 (ath) AT4G26280 (ath) ST2B (ath) ST2A (ath) AT5G43690 (ath) ST4B (ath) ST4C (ath) SOT7 (ath) SOT18 (ath) SOT16 (ath) LOC4330341 (osa) LOC4336454 (osa) LOC4346028 (osa) LOC7455783 (ppo) LOC7460261 (ppo) LOC7460262 (ppo) LOC7462804 (ppo) LOC7476805 (ppo) LOC7485446 (ppo) LOC7485561 (ppo) LOC7489806 (ppo) LOC9266117 (osa) LOC11405563 (mtr) LOC11420767 (mtr) LOC11423693 (mtr) LOC11425028 (mtr) LOC11433819 (mtr) LOC11444010 (mtr) LOC11444624 (mtr) LOC11444625 (mtr) LOC11445089 (mtr) LOC11445287 (mtr) LOC11445767 (mtr) LOC18097155 (ppo) LOC18097159 (ppo) LOC18097160 (ppo) LOC18097175 (ppo) LOC18102597 (ppo) LOC18102984 (ppo) LOC18102990 (ppo) LOC18108812 (ppo) LOC18109716 (ppo) LOC18109728 (ppo) LOC18109731 (ppo) LOC18111143 (ppo) LOC25490386 (mtr) LOC25497454 (mtr) LOC25497455 (mtr) LOC100776542 (gma) LOC100779412 (gma) LOC100789023 (gma) LOC100807092 (gma) LOC100809003 (gma) LOC100809551 (gma) LOC101244856 (sly) LOC101251094 (sly) LOC101251383 (sly) LOC101258523 (sly) LOC101259437 (sly) LOC101259576 (sly) LOC101259934 (sly) LOC101260818 (sly) LOC101261603 (sly) LOC103830718 (bra) LOC103830719 (bra) LOC103830983 (bra) LOC103831303 (bra) LOC103831395 (bra) LOC103831882 (bra) LOC103831884 (bra) LOC103831885 (bra) LOC103835350 (bra) LOC103836100 (bra) LOC103838248 (bra) LOC103838296 (bra) LOC103838472 (bra) LOC103838473 (bra) LOC103838626 (bra) LOC103838628 (bra) LOC103838722 (bra) LOC103838772 (bra) LOC103839383 (bra) LOC103839385 (bra) LOC103839388 (bra) LOC103839389 (bra) LOC103839674 (bra) LOC103839675 (bra) LOC103839676 (bra) LOC103847100 (bra) LOC103847563 (bra) LOC103848122 (bra) LOC103848133 (bra) LOC103848199 (bra) LOC103848241 (bra) LOC103849852 (bra) LOC103850640 (bra) LOC103852881 (bra) LOC103853931 (bra) LOC103854096 (bra) LOC103855652 (bra) LOC103855653 (bra) LOC103855655 (bra) LOC103855712 (bra) LOC103866022 (bra) LOC103871502 (bra) LOC103872656 (bra) LOC107275677 (osa) LOC107277961 (osa) LOC109118854 (sly) LOC109119490 (sly) LOC112326913 (ppo) LOC112326914 (ppo) LOC117128329 (bra) LOC123040197 (tae) LOC123041666 (tae) LOC123043348 (tae) LOC123046062 (tae) LOC123048295 (tae) LOC123048366 (tae) LOC123049629 (tae) LOC123050506 (tae) LOC123051119 (tae) LOC123053943 (tae) LOC123073692 (tae) LOC123075268 (tae) LOC123076465 (tae) LOC123076481 (tae) LOC123085780 (tae) LOC123134896 (tae) LOC123140786 (tae) LOC123147912 (tae) LOC123161446 (tae) LOC123184205 (tae) LOC123184206 (tae) LOC123184207 (tae) LOC123184404 (tae) LOC123185731 (tae) LOC123185732 (tae) LOC123186470 (tae) LOC123189191 (tae) LOC123410129 (hvu) LOC123427295 (hvu) LOC123427296 (hvu) LOC123428269 (hvu) LOC123429204 (hvu) LOC123429214 (hvu) LOC123429319 (hvu) LOC123440709 (hvu) LOC123440710 (hvu) | ||||||||||||||||||||||||||||||||||||||||||||||||||||||||||||||||||||||||||||||||||||
| Subcellular localization wolf |
|
||||||||||||||||||||||||||||||||||||||||||||||||||||||||||||||||||||||||||||||||||||
| Subcellular localization TargetP |
|
||||||||||||||||||||||||||||||||||||||||||||||||||||||||||||||||||||||||||||||||||||
| Gene coexpression | |||||||||||||||||||||||||||||||||||||||||||||||||||||||||||||||||||||||||||||||||||||
| Network*for coexpressed genes |
|
||||||||||||||||||||||||||||||||||||||||||||||||||||||||||||||||||||||||||||||||||||
|---|---|---|---|---|---|---|---|---|---|---|---|---|---|---|---|---|---|---|---|---|---|---|---|---|---|---|---|---|---|---|---|---|---|---|---|---|---|---|---|---|---|---|---|---|---|---|---|---|---|---|---|---|---|---|---|---|---|---|---|---|---|---|---|---|---|---|---|---|---|---|---|---|---|---|---|---|---|---|---|---|---|---|---|---|---|
| Coexpressed gene list |
[Coexpressed gene list for SOT17] | ||||||||||||||||||||||||||||||||||||||||||||||||||||||||||||||||||||||||||||||||||||
| Gene expression | |||||||||||||||||||||||||||||||||||||||||||||||||||||||||||||||||||||||||||||||||||||
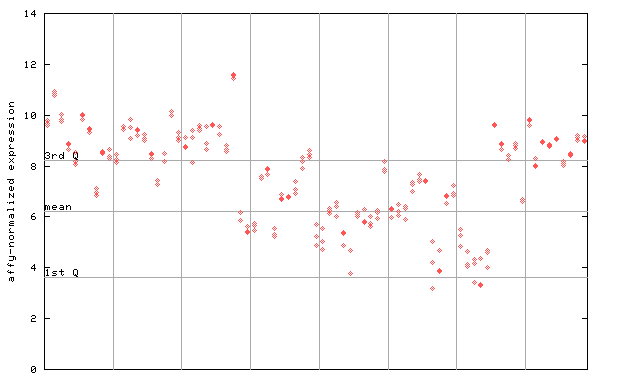
| All samples | [Expression pattern for all samples] | ||||||||||||||||||||||||||||||||||||||||||||||||||||||||||||||||||||||||||||||||||||
| AtGenExpress* (Development) |
255773_at

X axis is samples (pdf file), and Y axis is log2-expression. |
||||||||||||||||||||||||||||||||||||||||||||||||||||||||||||||||||||||||||||||||||||
| AtGenExpress* (Stress) |
255773_at

X axis is samples (pdf file), and Y axis is log2-expression. |
||||||||||||||||||||||||||||||||||||||||||||||||||||||||||||||||||||||||||||||||||||
| AtGenExpress* (Hormone) |
255773_at

X axis is samples (xls file), and Y axis is log-expression. |
||||||||||||||||||||||||||||||||||||||||||||||||||||||||||||||||||||||||||||||||||||
| Link to other DBs | ||
| Entrez Gene ID | 838440 |


|
| Refseq ID (protein) | NP_173294.1 |  |
The preparation time of this page was 0.1 [sec].


