| functional annotation |
| Function |
autoinhibited Ca2+-ATPase 1 |


|
| GO BP |
|
GO:0070588 [list] [network] calcium ion transmembrane transport
|
(22 genes)
|
IEA
|
 |
|
GO:0010200 [list] [network] response to chitin
|
(304 genes)
|
IEA
|
 |
|
GO:0009751 [list] [network] response to salicylic acid
|
(438 genes)
|
IEA
|
 |
|
GO:0002376 [list] [network] immune system process
|
(453 genes)
|
IEA
|
 |
|
GO:0009651 [list] [network] response to salt stress
|
(607 genes)
|
IEA
|
 |
|
GO:0050832 [list] [network] defense response to fungus
|
(705 genes)
|
IEA
|
 |
|
GO:0031347 [list] [network] regulation of defense response
|
(749 genes)
|
IEA
|
 |
|
GO:0009611 [list] [network] response to wounding
|
(816 genes)
|
IEA
|
 |
|
GO:0009755 [list] [network] hormone-mediated signaling pathway
|
(904 genes)
|
IEA
|
 |
|
GO:0048523 [list] [network] negative regulation of cellular process
|
(960 genes)
|
IEA
|
 |
|
GO:0042742 [list] [network] defense response to bacterium
|
(980 genes)
|
IEA
|
 |
|
GO:0009737 [list] [network] response to abscisic acid
|
(1086 genes)
|
IEA
|
 |
|
GO:1901701 [list] [network] cellular response to oxygen-containing compound
|
(1115 genes)
|
IEA
|
 |
|
| GO CC |
|
| GO MF |
|
| KEGG |
|
|
| Protein |
NP_001321521.1
NP_001321522.1
NP_564295.1
NP_849716.1
|
| BLAST |
NP_001321521.1
NP_001321522.1
NP_564295.1
NP_849716.1
|
| Orthologous |
[Ortholog page]
SCA1 (gma)
SCA2 (gma)
ACA7 (ath)
ACA2 (ath)
LOC4331984 (osa)
LOC4352664 (osa)
LOC7497329 (ppo)
LOC11406848 (mtr)
LOC11430995 (mtr)
LOC18101104 (ppo)
LOC25489959 (mtr)
LOC100776926 (gma)
LOC100792691 (gma)
LOC100810758 (gma)
LOC100815662 (gma)
LOC101246688 (sly)
LOC101260132 (sly)
LOC101260388 (sly)
LOC103835040 (bra)
LOC103835369 (bra)
LOC103842447 (bra)
LOC103862566 (bra)
LOC123084995 (tae)
LOC123093069 (tae)
LOC123098353 (tae)
LOC123102388 (tae)
LOC123110565 (tae)
LOC123119579 (tae)
LOC123397922 (hvu)
LOC123449394 (hvu)
|
Subcellular
localization
wolf |
|
plas 7,
E.R. 2
|
(predict for NP_001321521.1)
|
|
plas 9,
vacu 1,
E.R. 1,
E.R._vacu 1
|
(predict for NP_001321522.1)
|
|
plas 9,
vacu 1,
E.R. 1,
E.R._vacu 1
|
(predict for NP_564295.1)
|
|
plas 9,
vacu 1,
E.R. 1,
E.R._vacu 1
|
(predict for NP_849716.1)
|
|
Subcellular
localization
TargetP |
|
mito 6,
other 3
|
(predict for NP_001321521.1)
|
|
other 8
|
(predict for NP_001321522.1)
|
|
other 8
|
(predict for NP_564295.1)
|
|
other 8
|
(predict for NP_849716.1)
|
|
| Gene coexpression |
Network*for
coexpressed
genes |
| KEGG* ID |
Title |
#genes |
Link to the KEGG* map
(Multiple genes) |
| ath04626 |
Plant-pathogen interaction |
3 |
 |
Genes directly connected with ACA1 on the network
| coex z* |
Locus |
Function* |
CoexViewer |
Entrez Gene ID* |
| 11.9 |
ADR1-L2 |
ADR1-like 2 |
[detail] |
830350 |
| 11.0 |
CPK28 |
calcium-dependent protein kinase 28 |
[detail] |
836753 |
| 10.8 |
NUDT7 |
MutT/nudix family protein |
[detail] |
826884 |
| 8.9 |
XLG2 |
extra-large GTP-binding protein 2 |
[detail] |
829589 |
| 8.3 |
FC1 |
ferrochelatase 1 |
[detail] |
832672 |
| 8.2 |
AT5G66675 |
transmembrane protein, putative (DUF677) |
[detail] |
836800 |
| 8.1 |
AT5G42050 |
DCD (Development and Cell Death) domain protein |
[detail] |
834210 |
| 8.0 |
AT5G62570 |
Calmodulin binding protein-like protein |
[detail] |
836377 |
| 7.9 |
AT1G69840 |
SPFH/Band 7/PHB domain-containing membrane-associated protein family |
[detail] |
843320 |
| 7.7 |
ADR1 |
Disease resistance protein (CC-NBS-LRR class) family |
[detail] |
840250 |
| 7.4 |
ACA10 |
autoinhibited Ca(2+)-ATPase 10 |
[detail] |
829112 |
| 7.3 |
AT1G31130 |
polyadenylate-binding protein 1-B-binding protein |
[detail] |
839998 |
| 6.8 |
CPK4 |
calcium-dependent protein kinase 4 |
[detail] |
826541 |
|
Coexpressed
gene list |
[Coexpressed gene list for ACA1]
|
| Gene expression |
| All samples |
[Expression pattern for all samples]
|
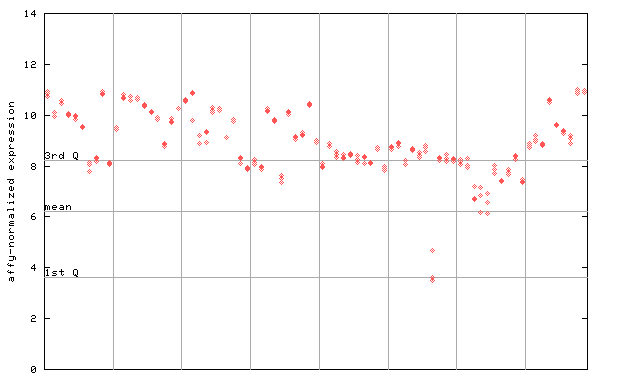
AtGenExpress*
(Development) |
261650_at

X axis is samples (pdf file), and Y axis is log2-expression.
"1st Q", "mean" and "3rd Q" indecate the values for all genes on a GeneChip. Q: quartile.
|
AtGenExpress*
(Stress) |
261650_at

X axis is samples (pdf file), and Y axis is log2-expression.
|
AtGenExpress*
(Hormone) |
261650_at

X axis is samples (xls file), and Y axis is log-expression.
|


